A connected dose profile.
Use spatial correlation to reconstruct dose along the biopsy, predict withheld segments and quantify the profile's uncertainty.
Research connections
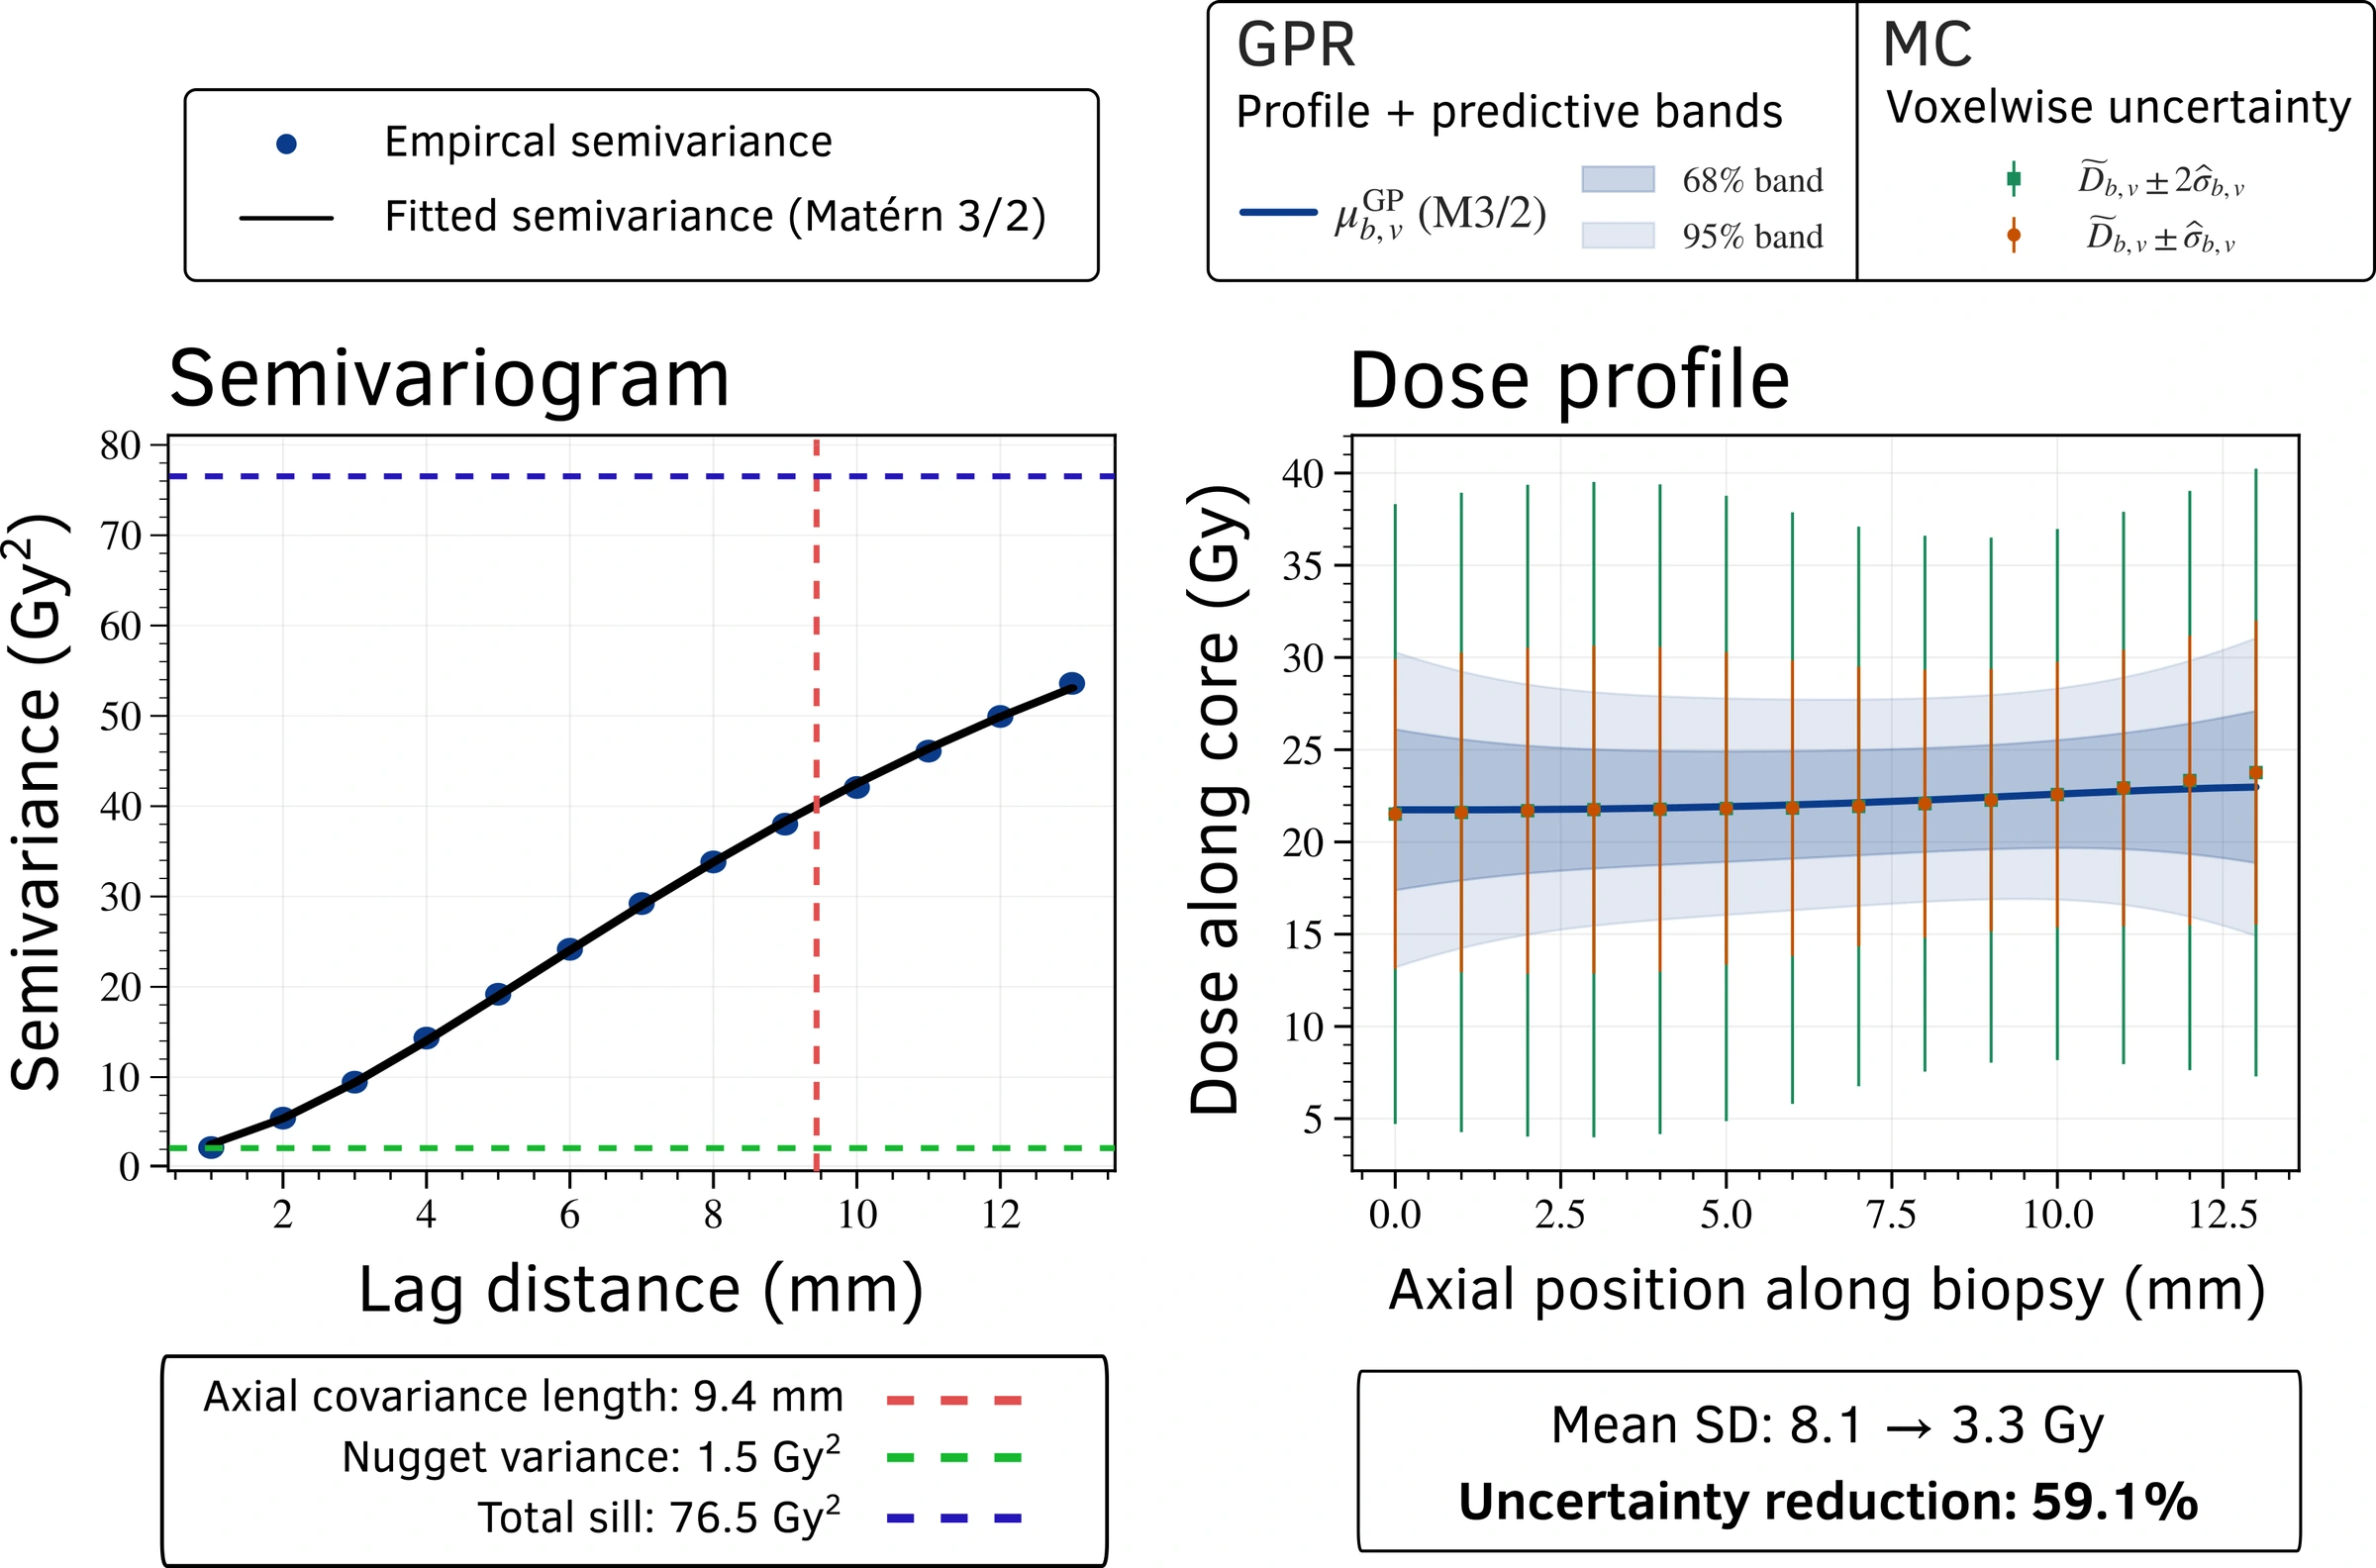
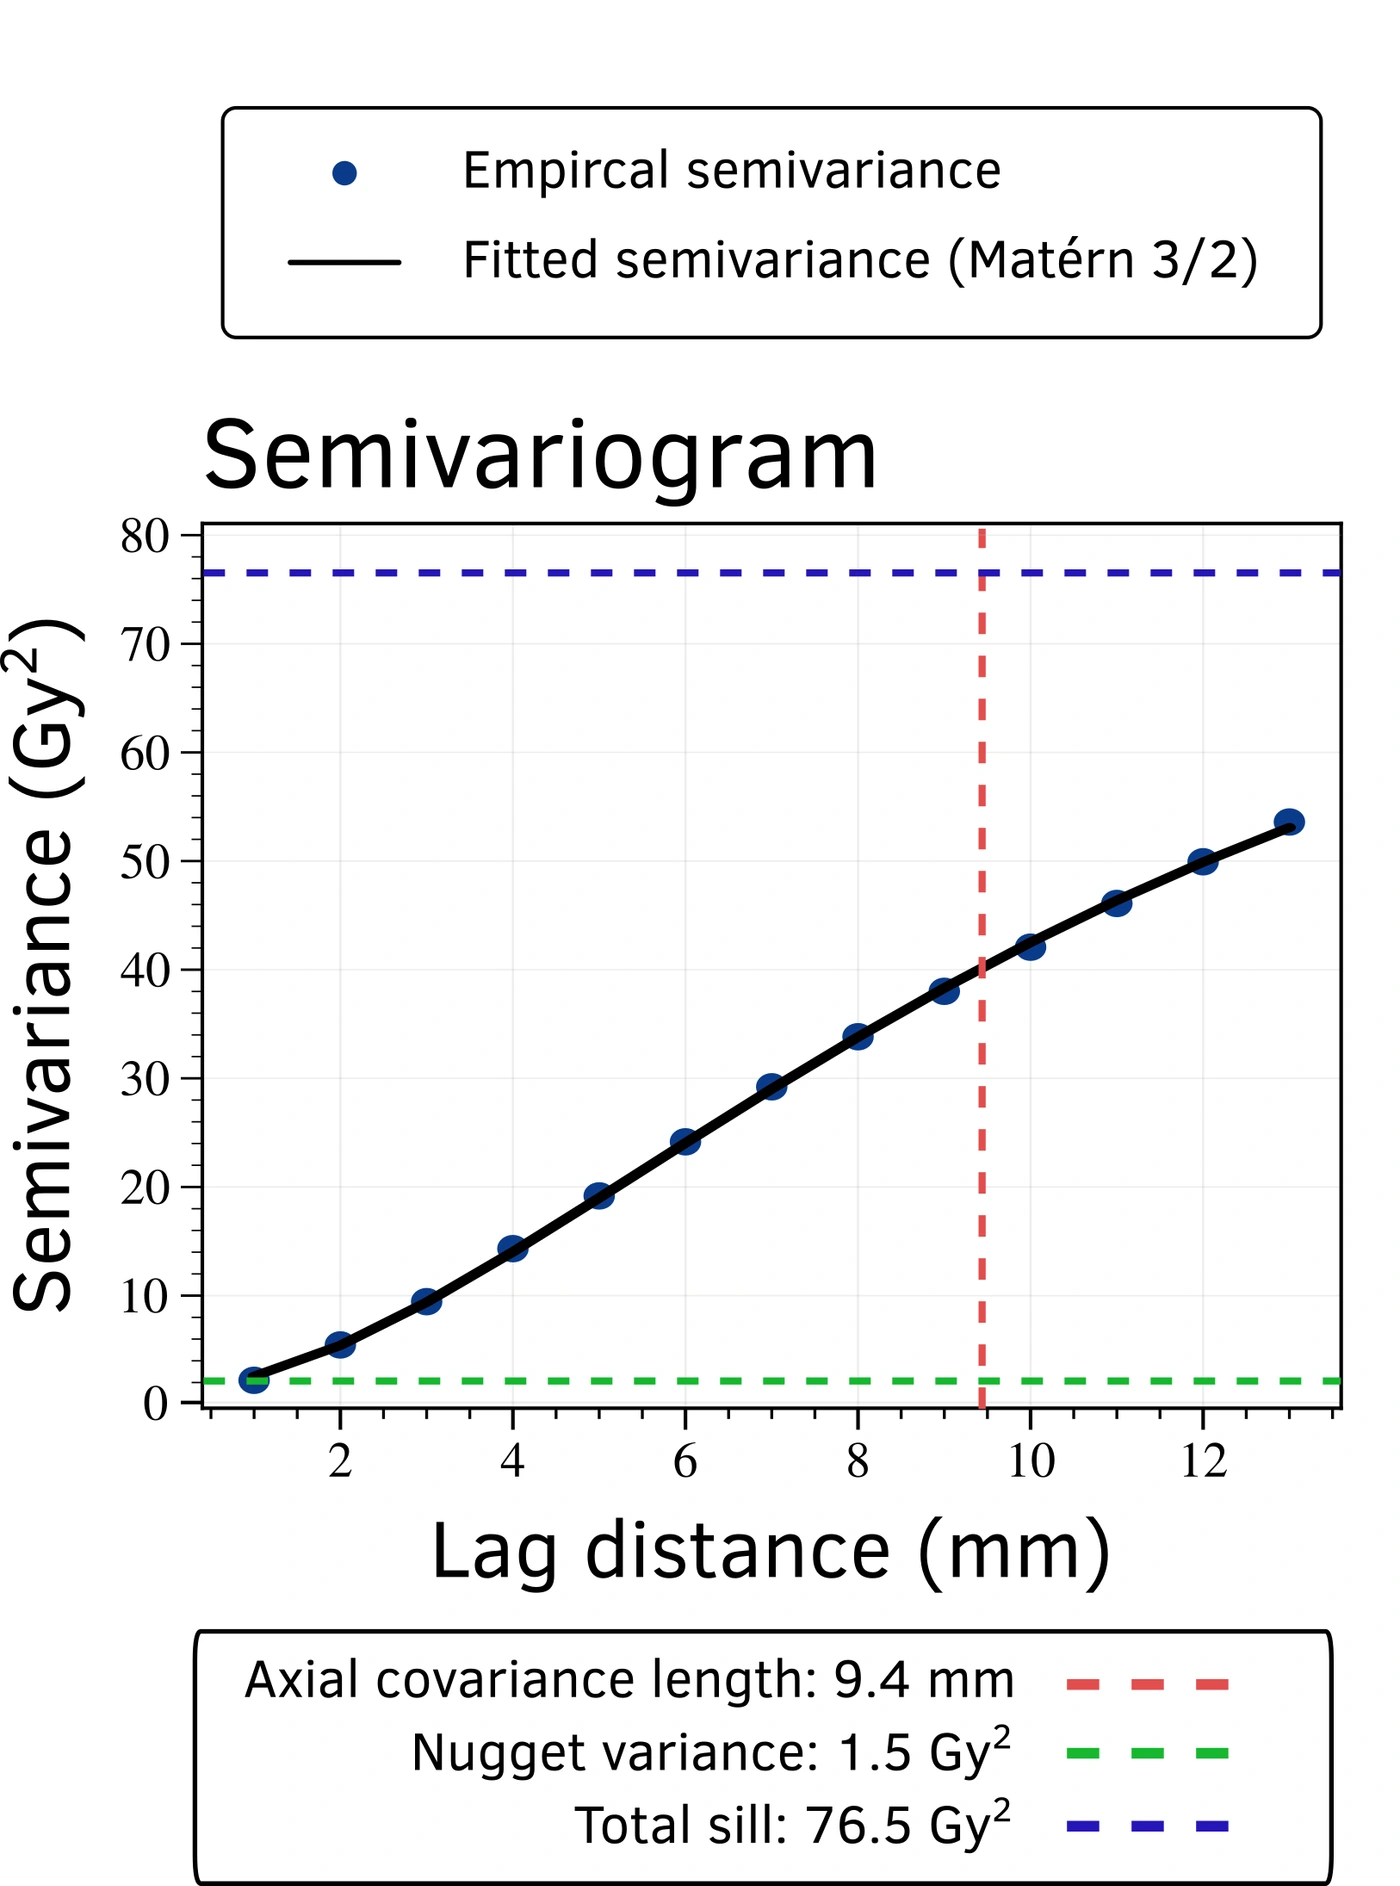
Nearby positions inform the dose profile.
Learn how dose varies with distance along each core. That spatial relationship turns uncertain local estimates into a continuous profile with model-based uncertainty.
Interpretation. This example estimates an underlying dose profile. Its uncertainty bands do not describe a more certain physical biopsy location.
Test the profile on withheld sections.
Fit the model without one stretch of the core, then compare predictions there with the simulated dose estimates left out of the fit.
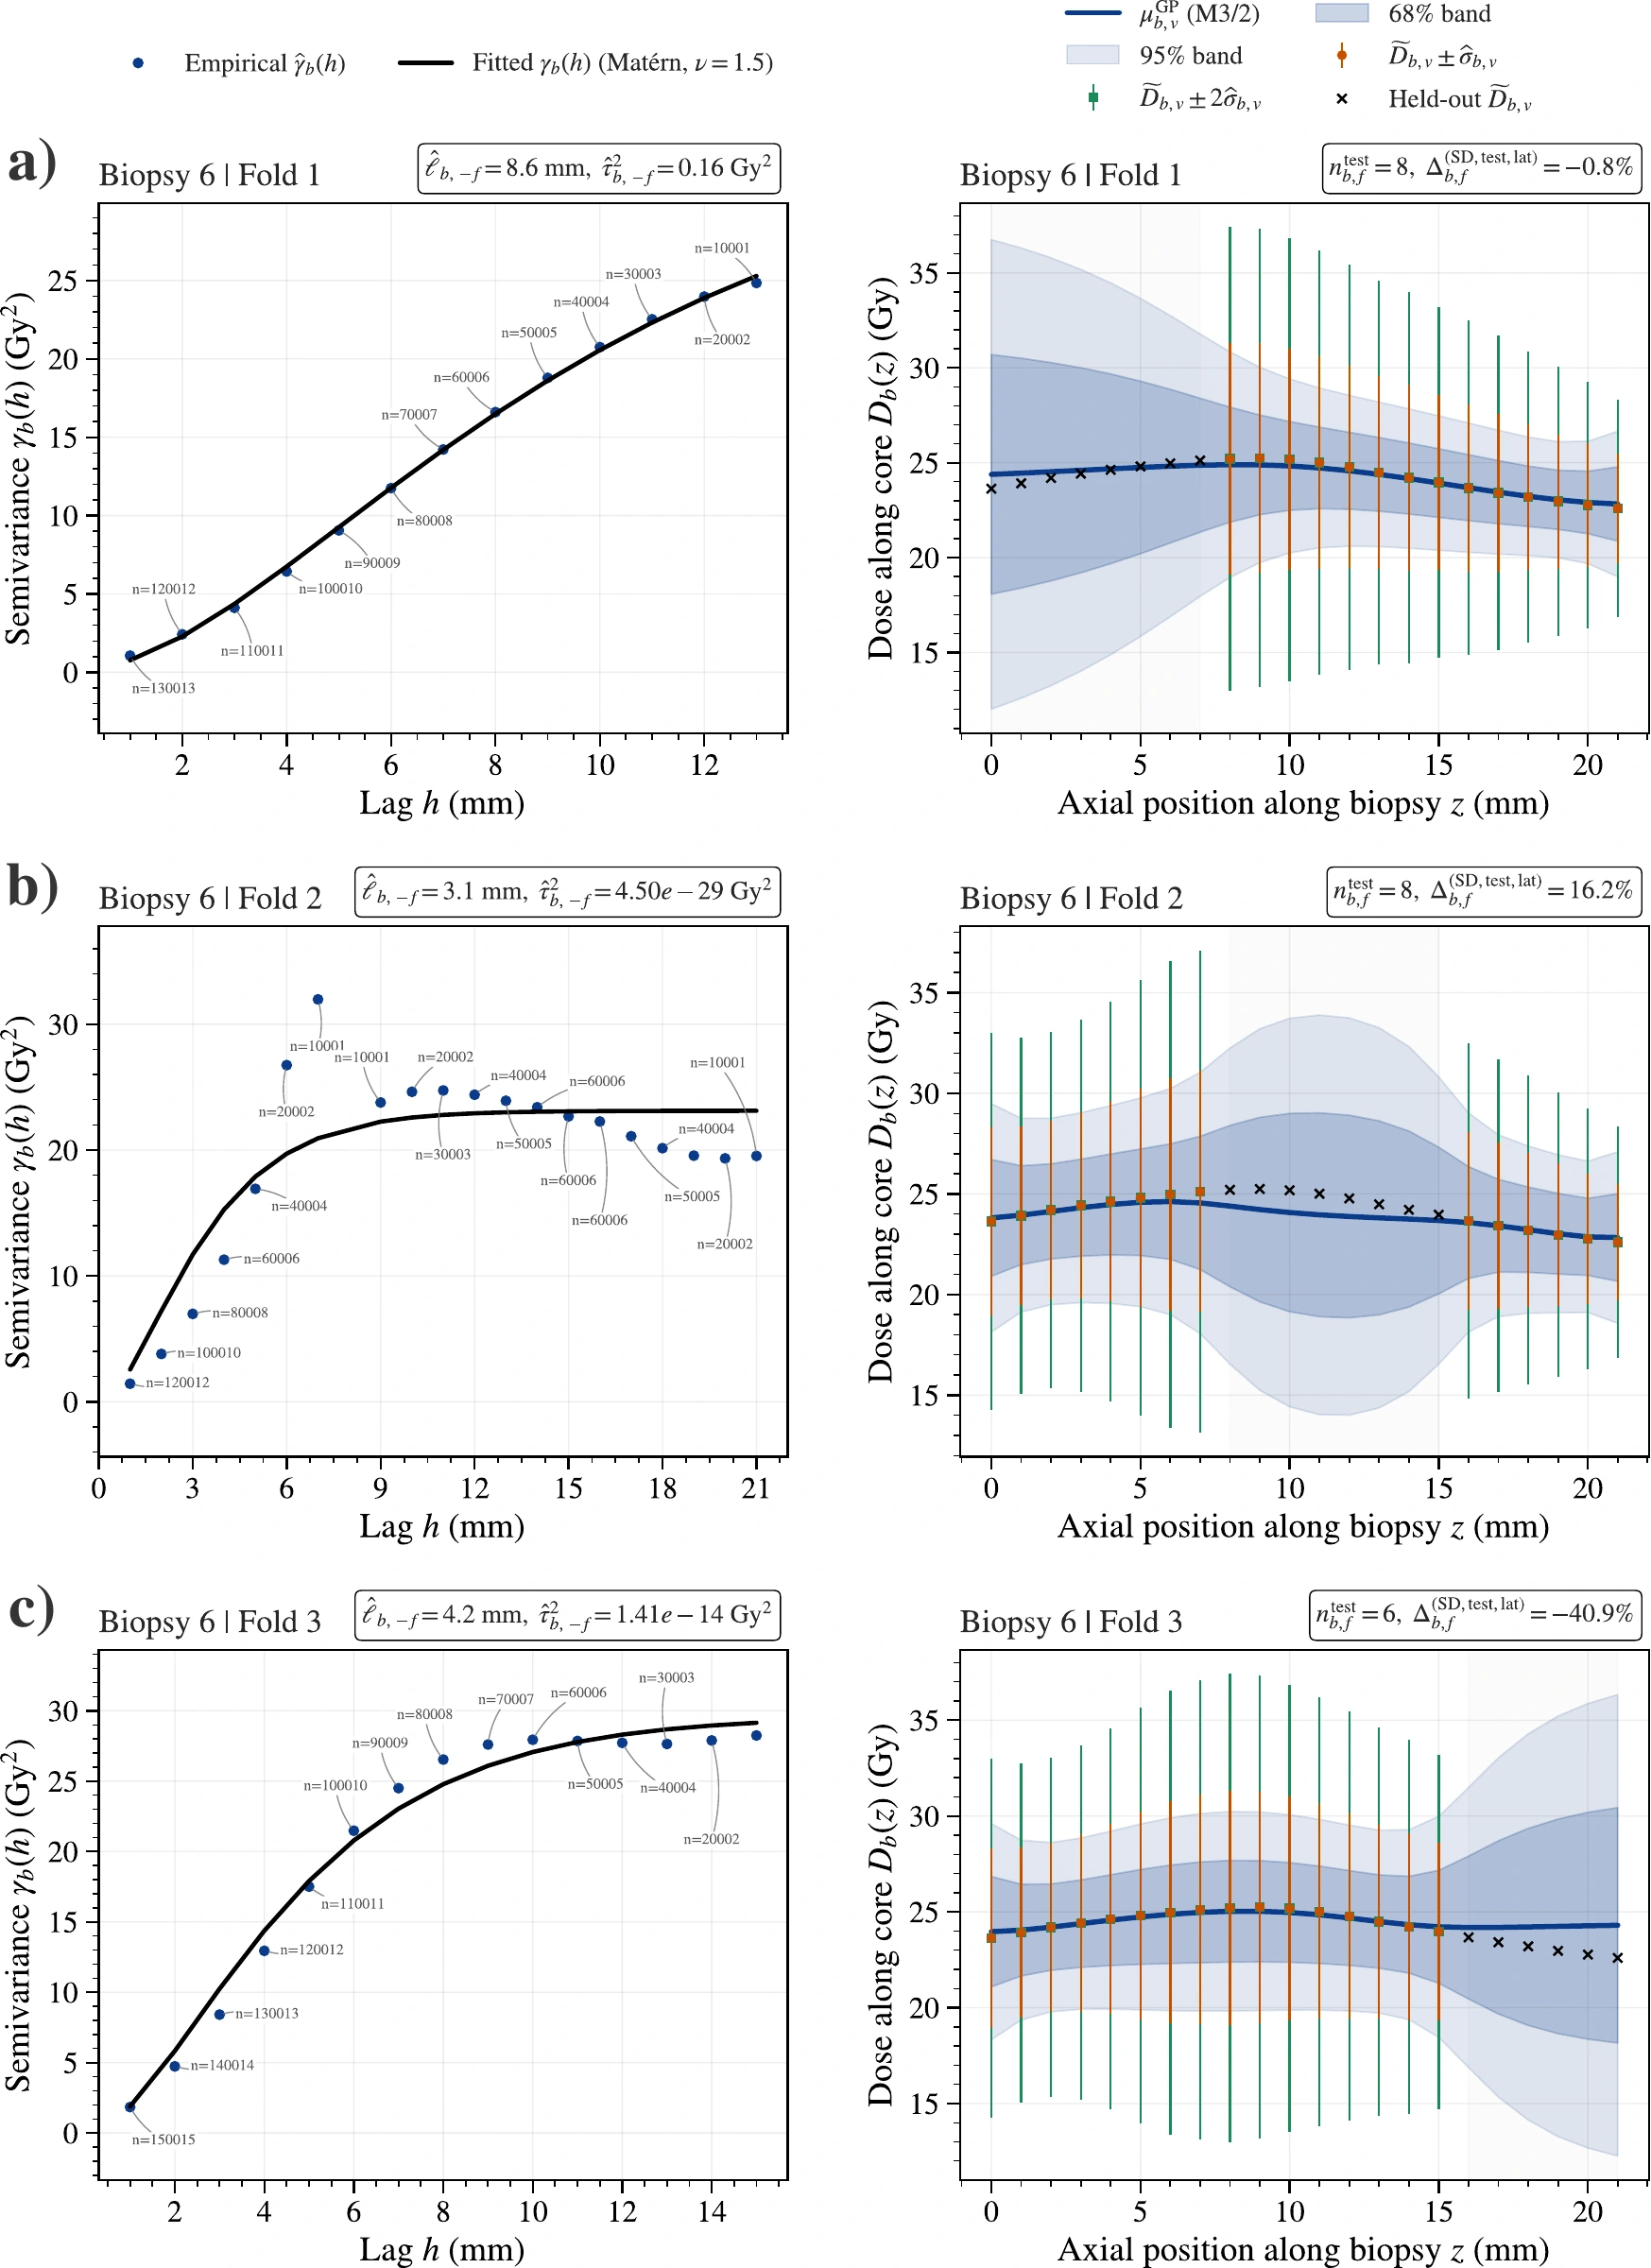
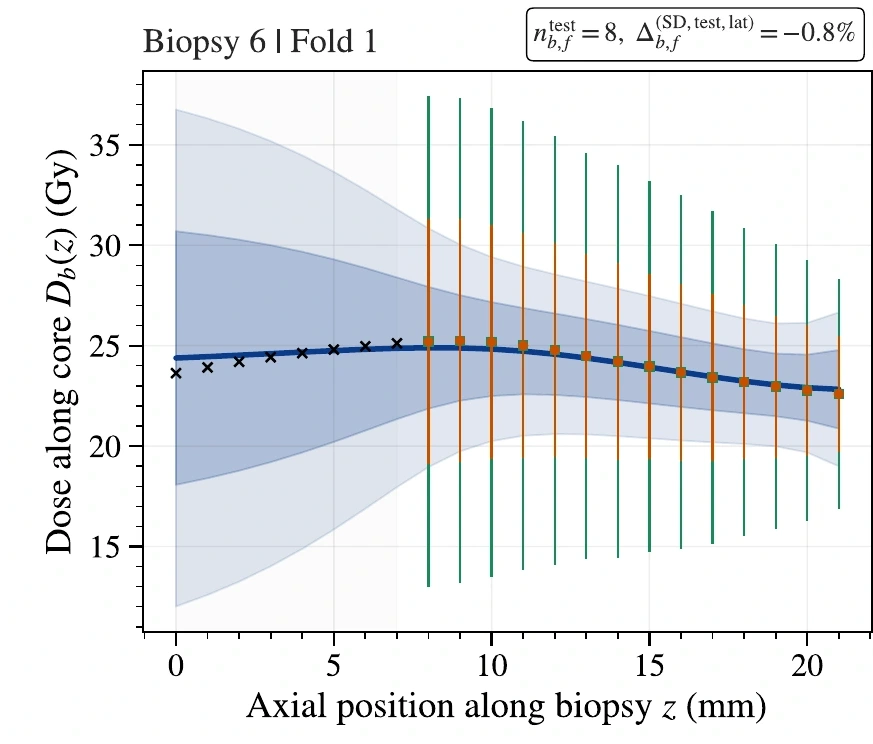
Predict a section left out.
Fit the model without one stretch of the core. Then compare its predictions with the dose estimates withheld from the fit.
Study scope. Predictions are tested against withheld simulated dose estimates, not independent measurements in tissue.
From possible locations to a dose profile.
First, simulate plausible biopsy locations and map their doses. Gaussian process regression (GPR) then combines those estimates with the spatial relationship along each core to estimate its dose profile and uncertainty.
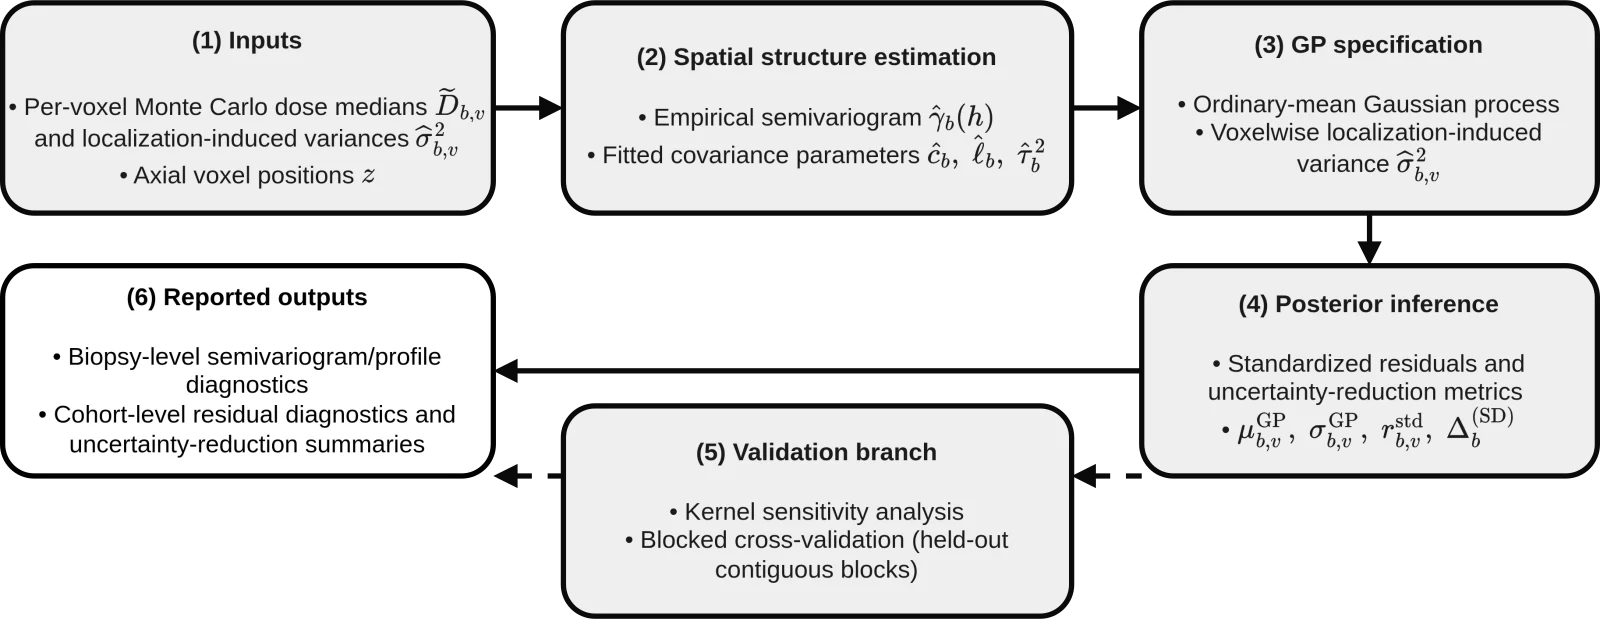
Retain the differences between cores.
Dose trends and their spatial scales vary. Each core gets its own fitted relationship rather than a single shared dose profile.
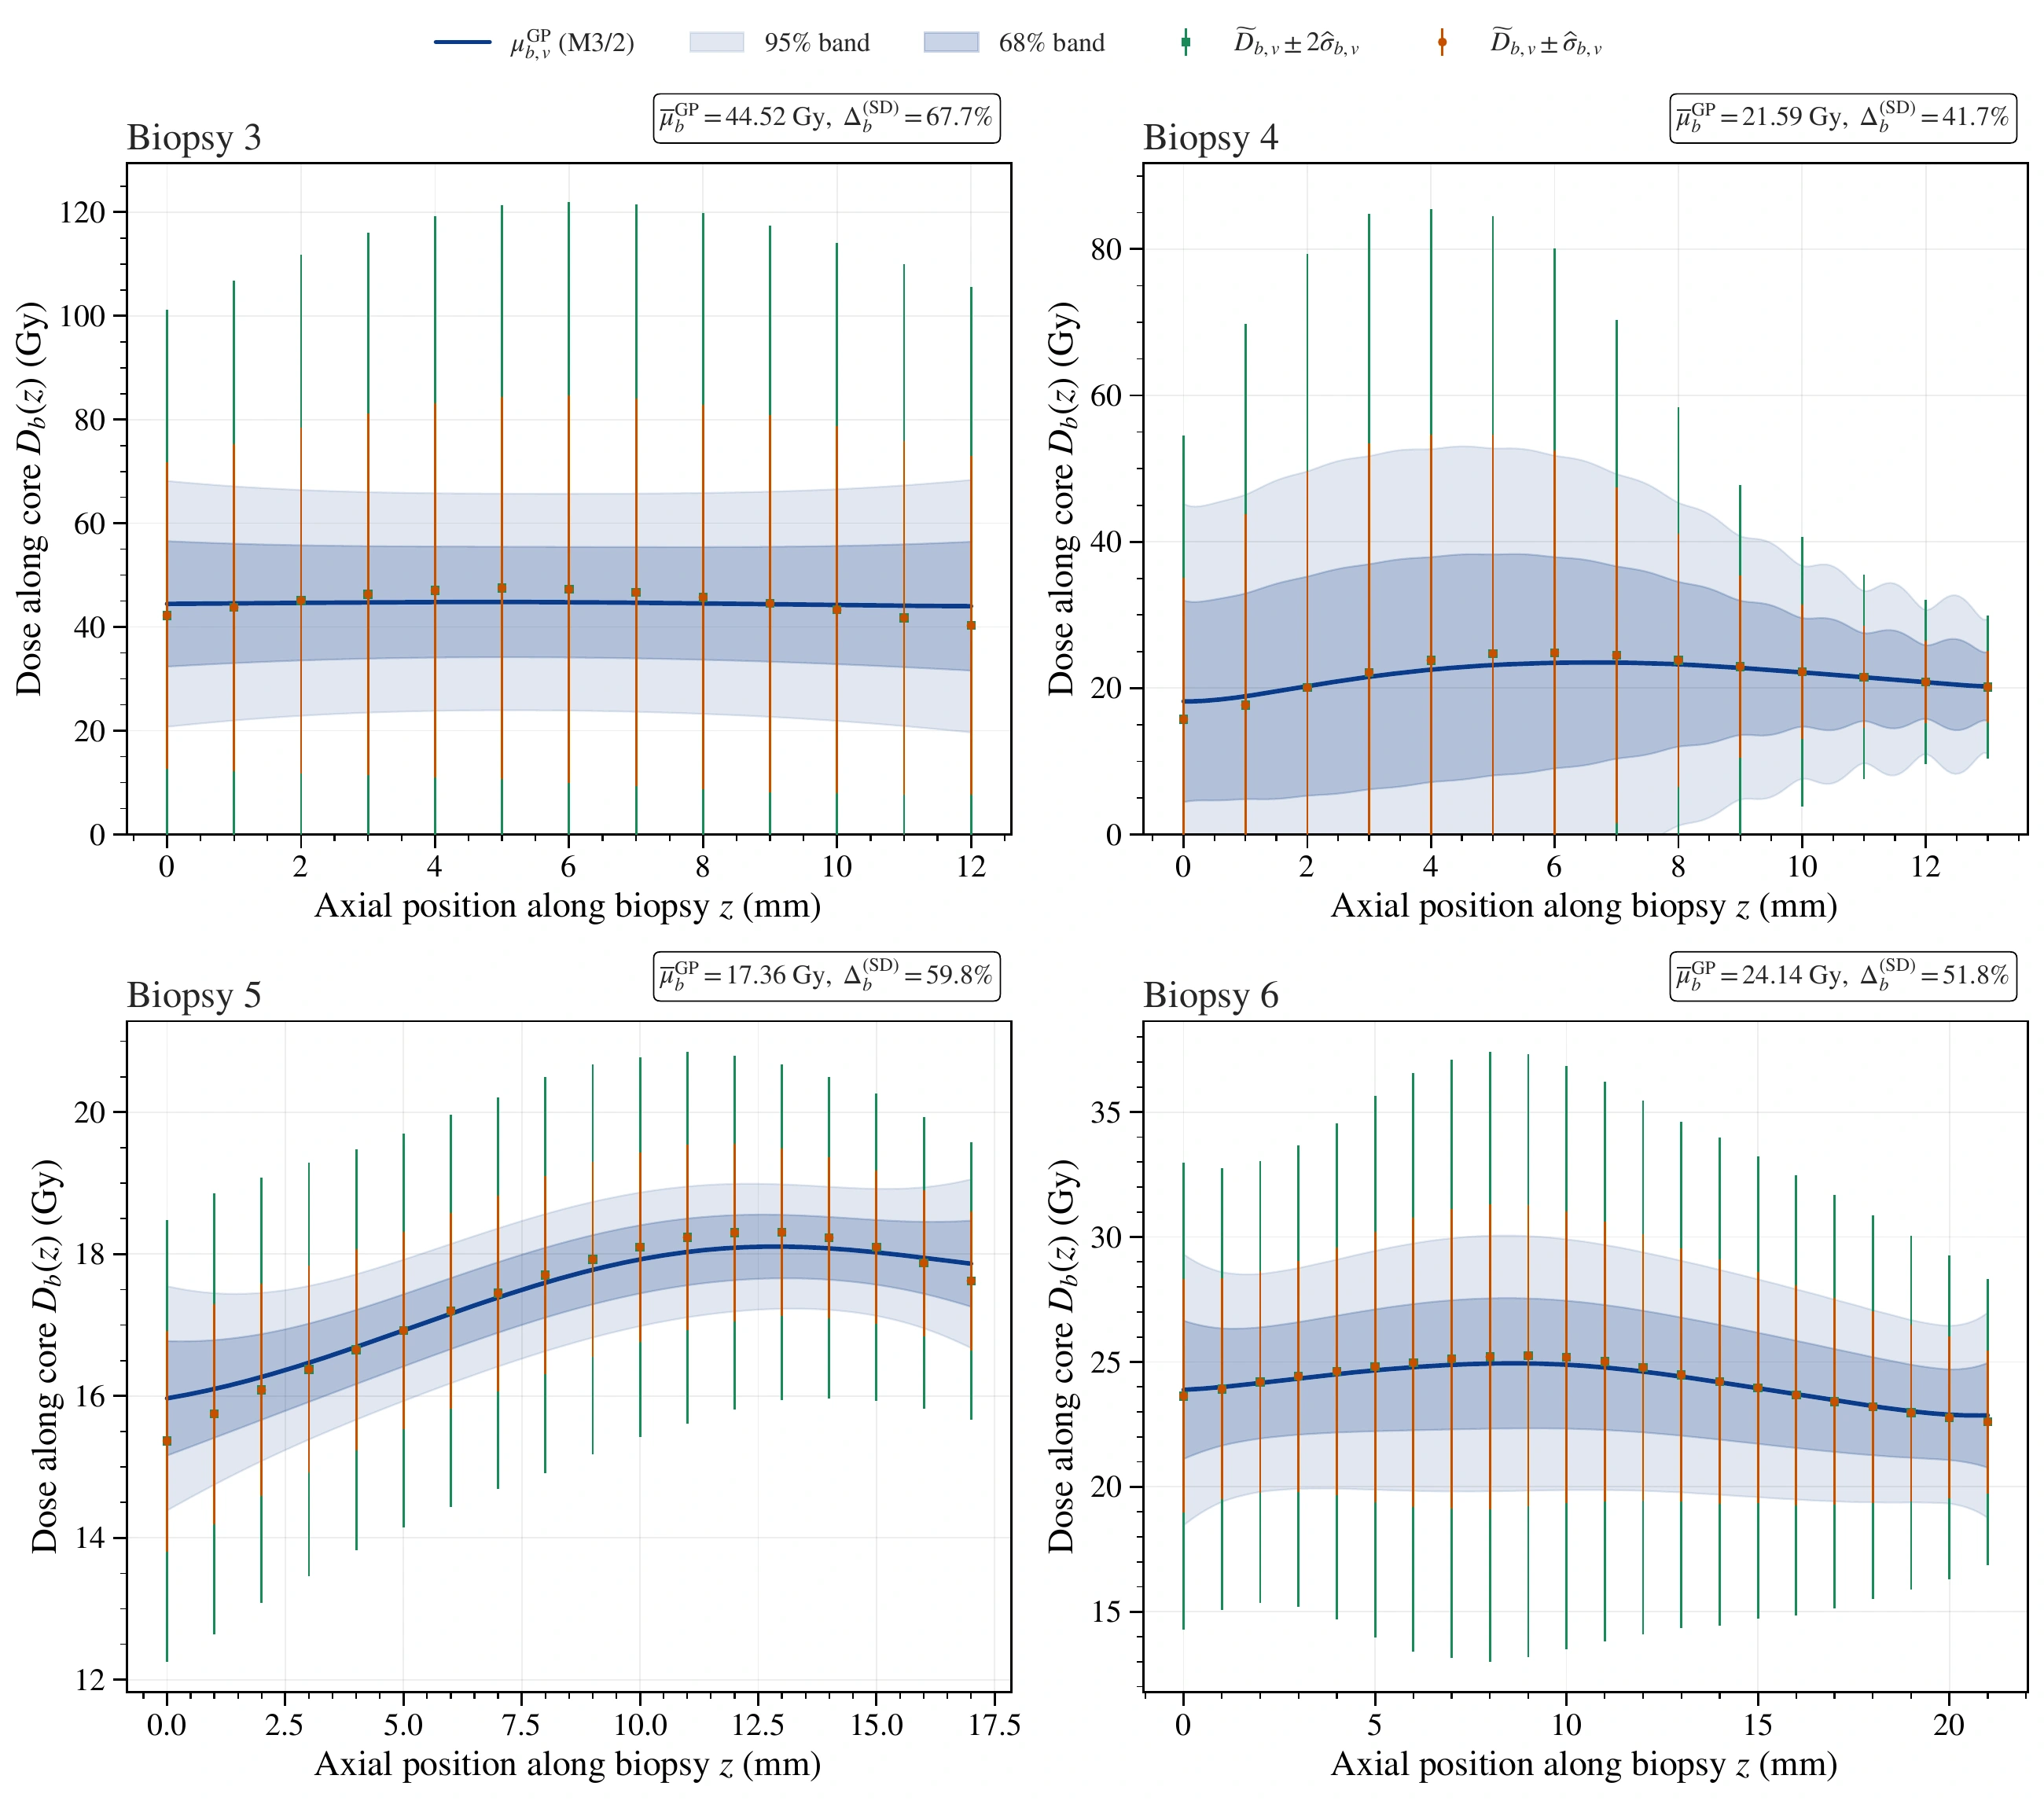
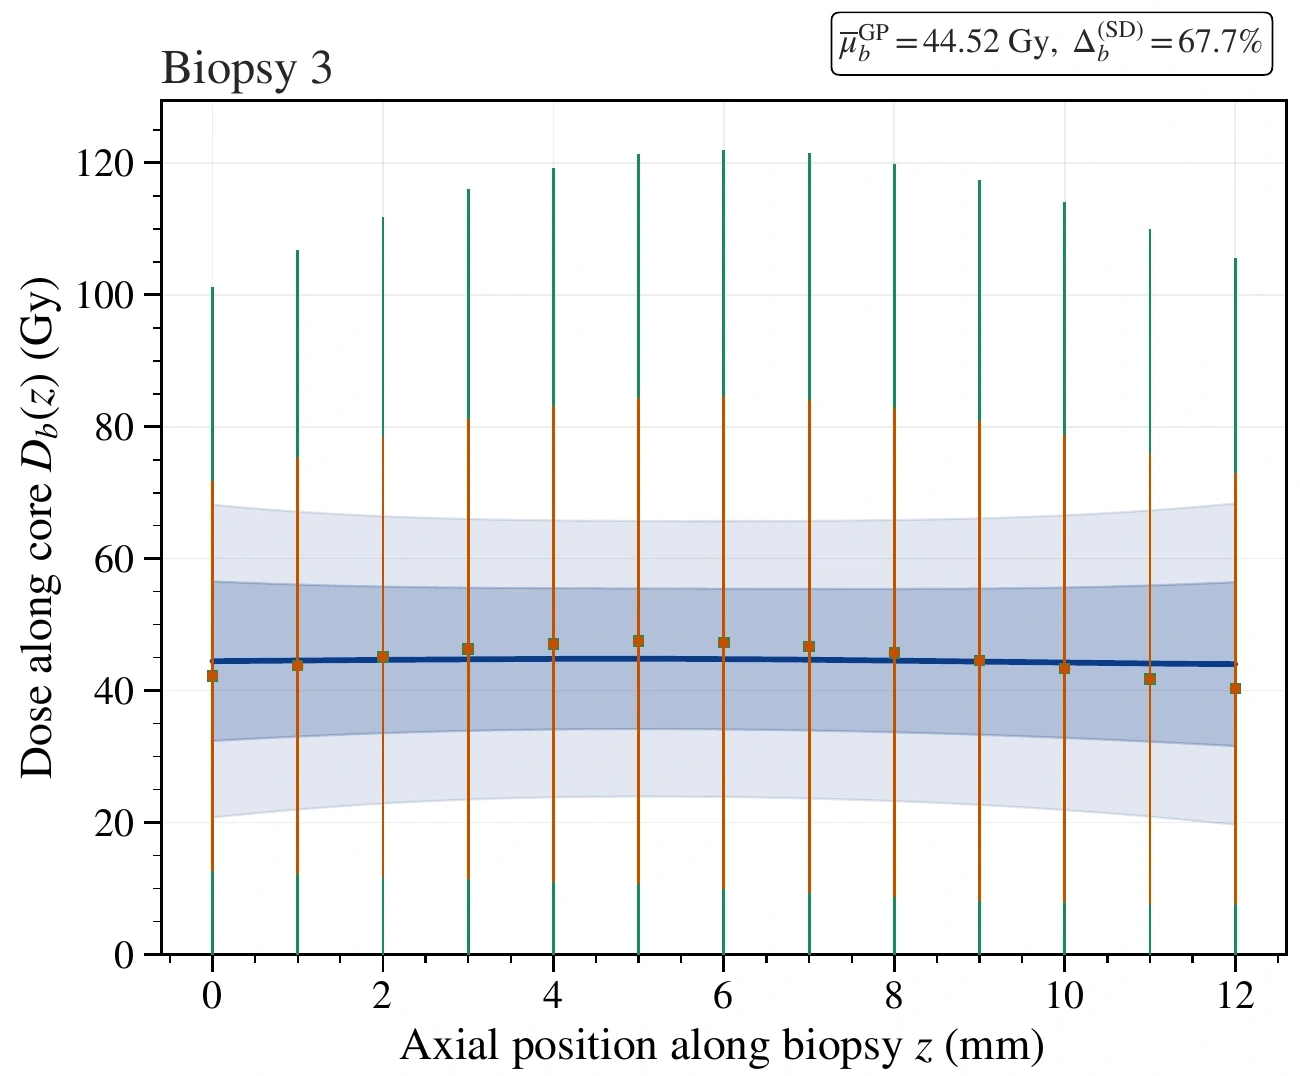
Spatial correlation narrows uncertainty in the estimated profile.
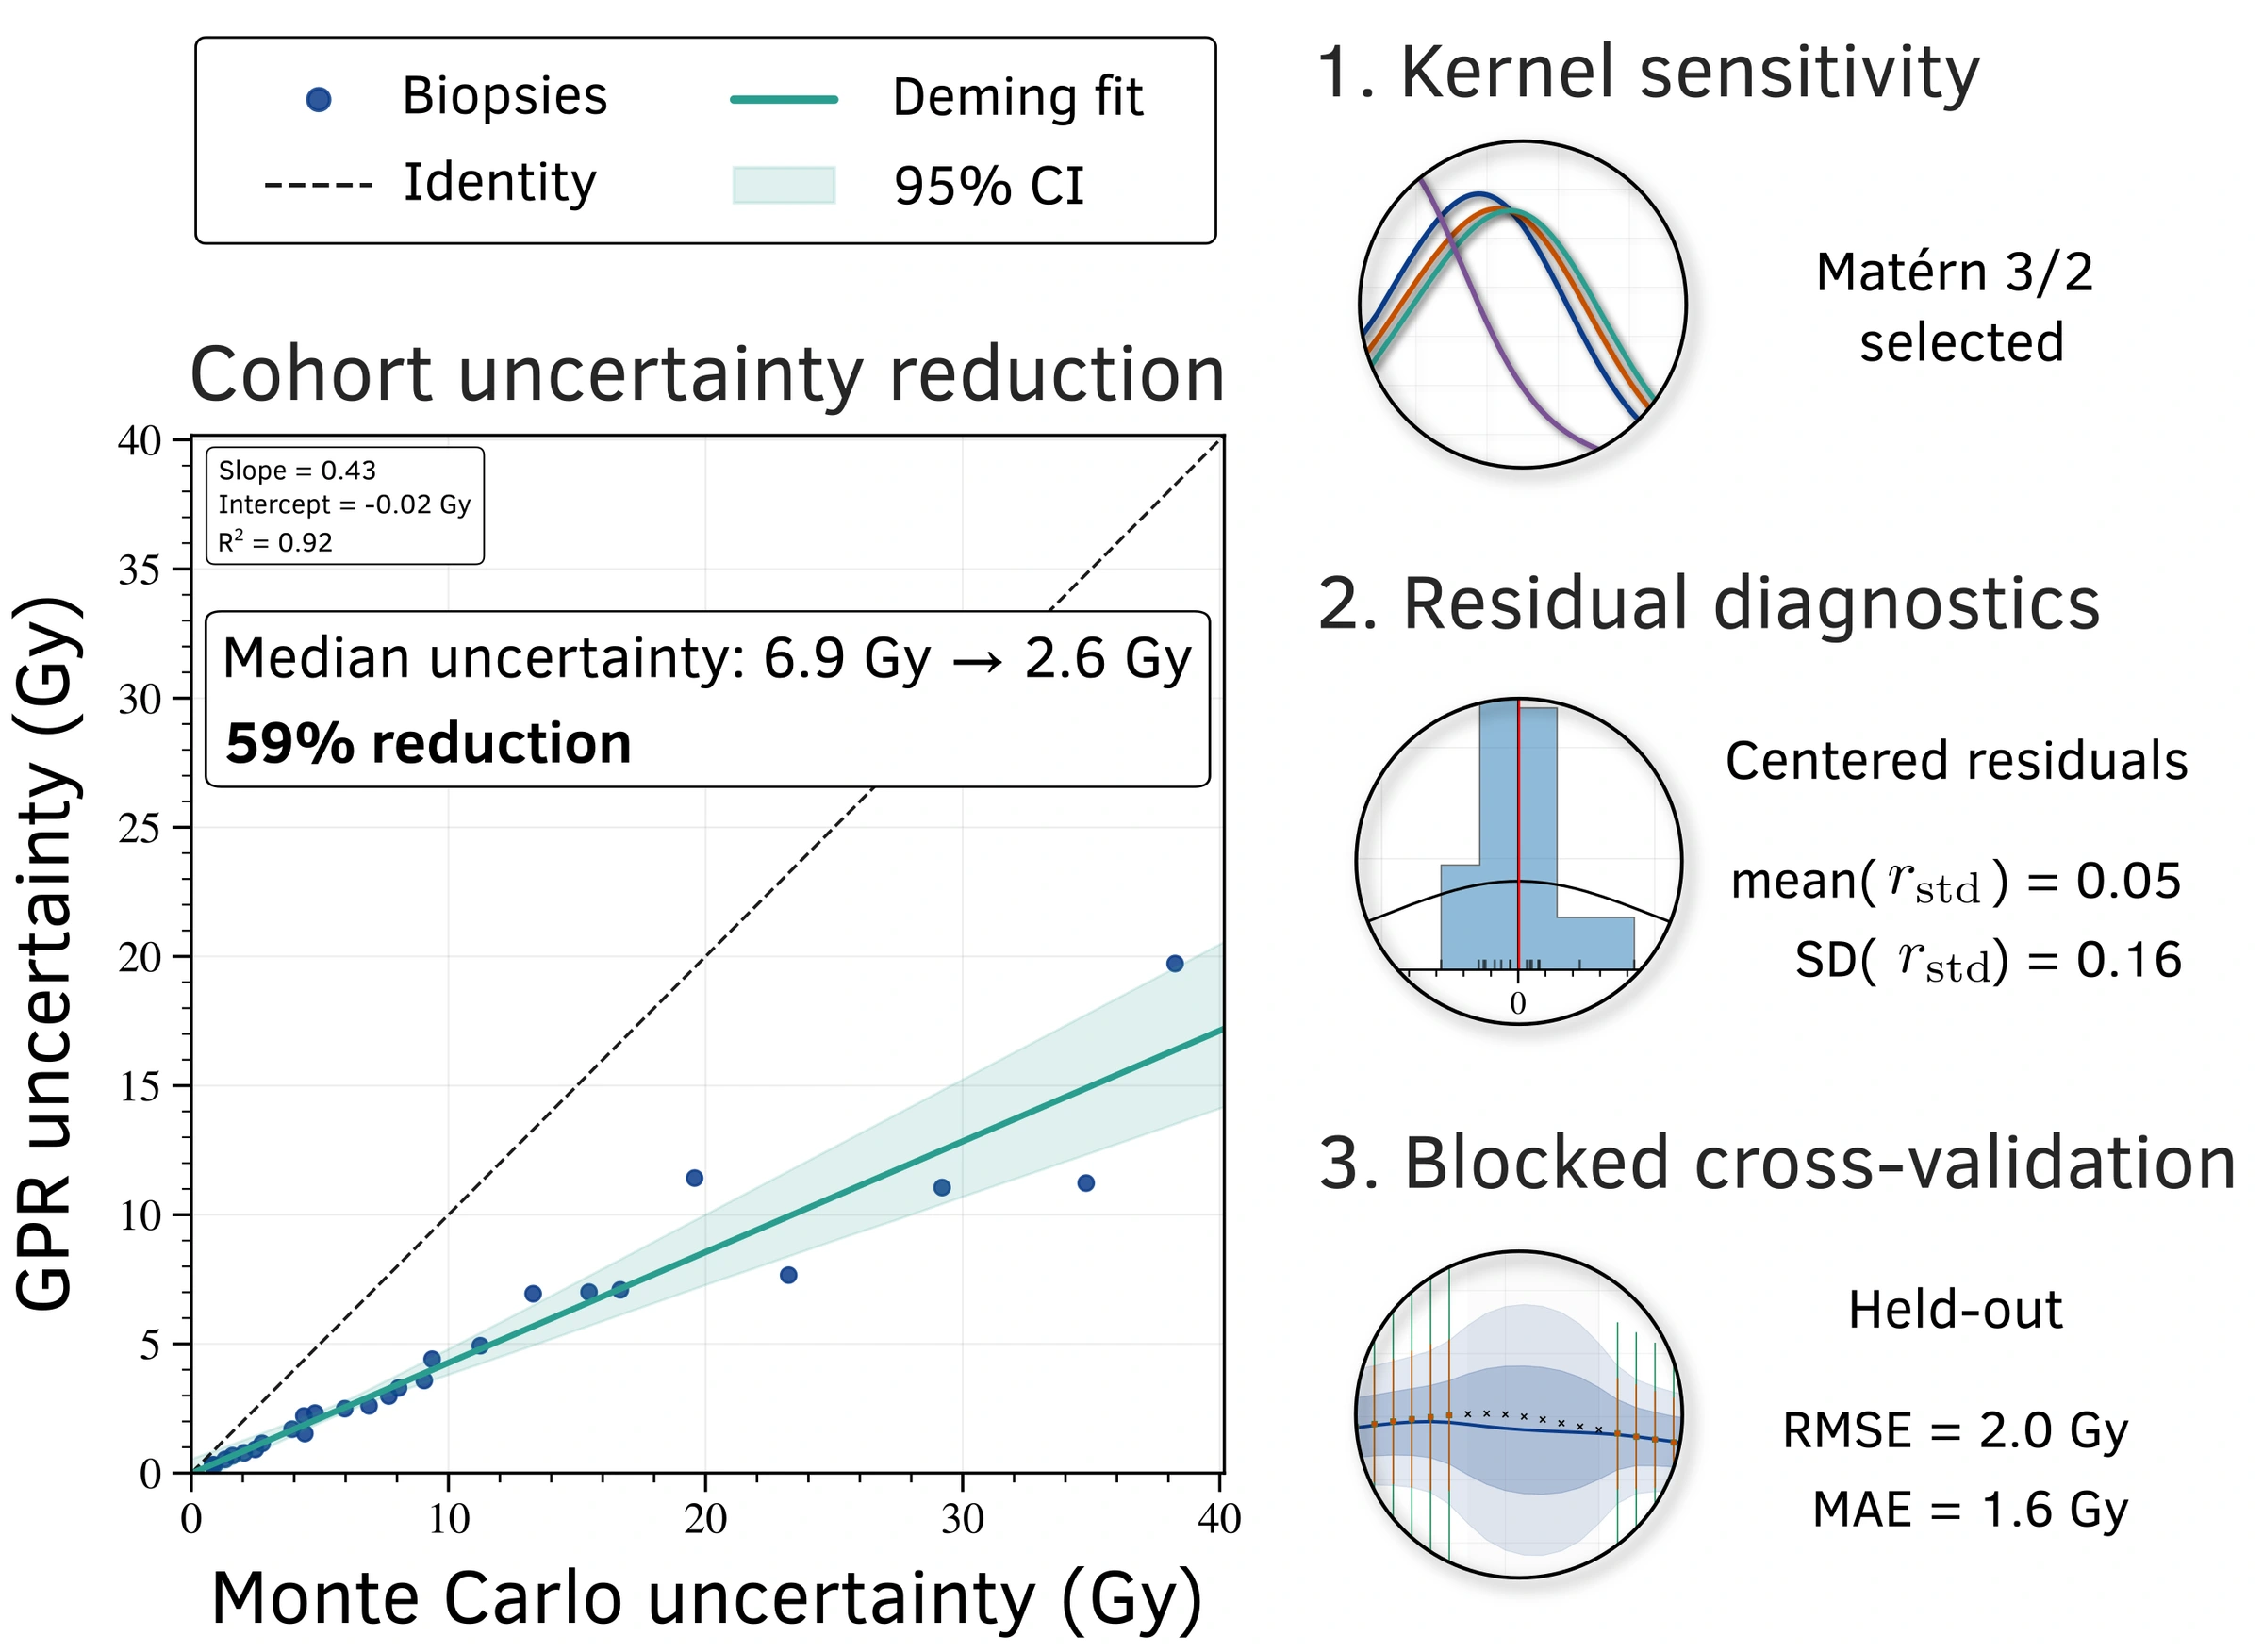
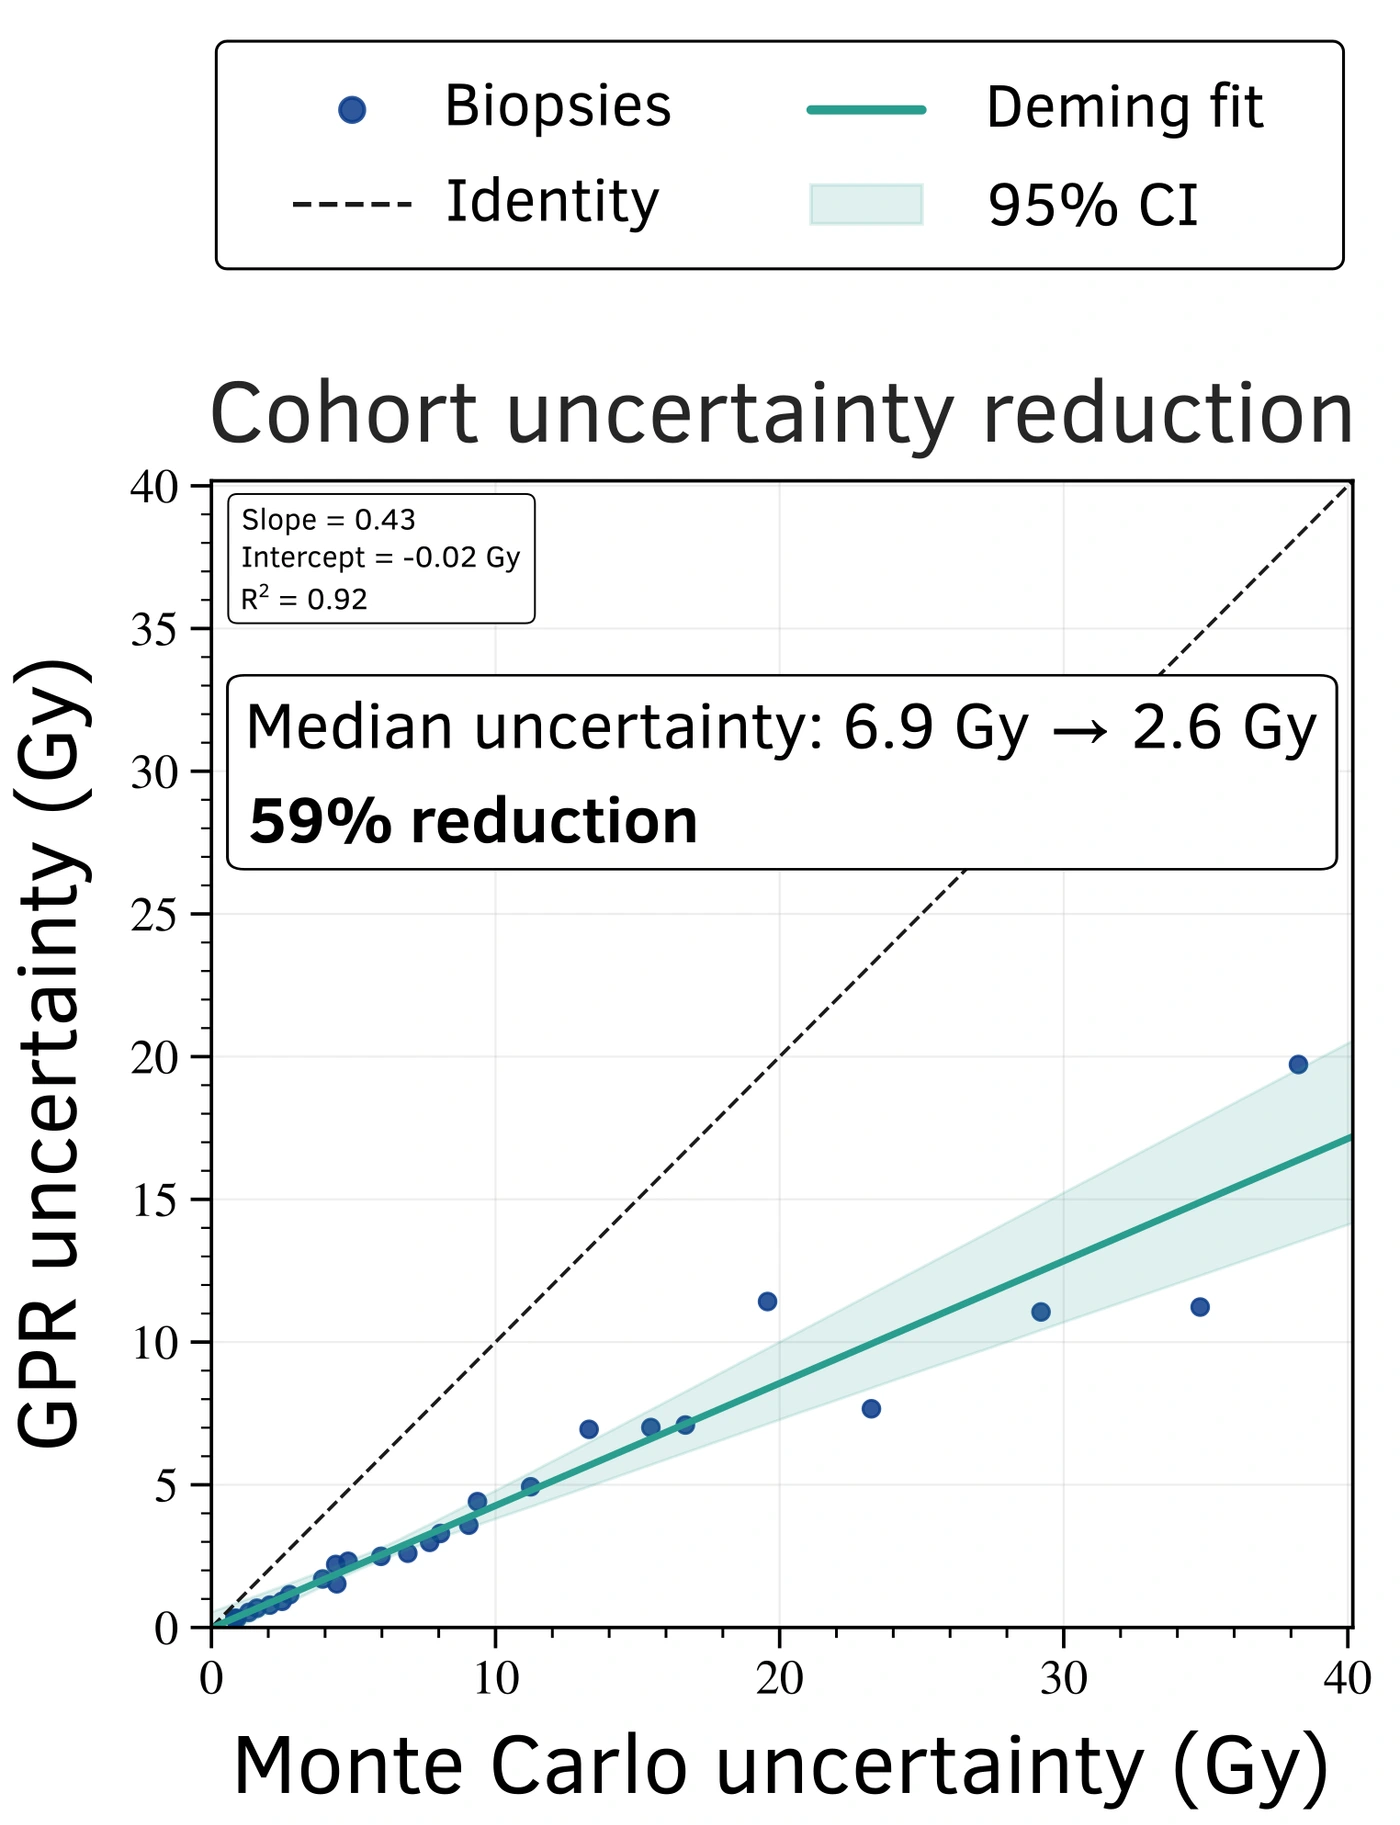
Across 27 biopsies, the median within-biopsy reduction from Monte Carlo standard deviation to latent GP posterior standard deviation was 59.1%.
Interpretation. The comparison is between location-induced dose spread and uncertainty in the estimated underlying profile. It does not mean 59.1% less physical location error.
What do the narrower bands describe?
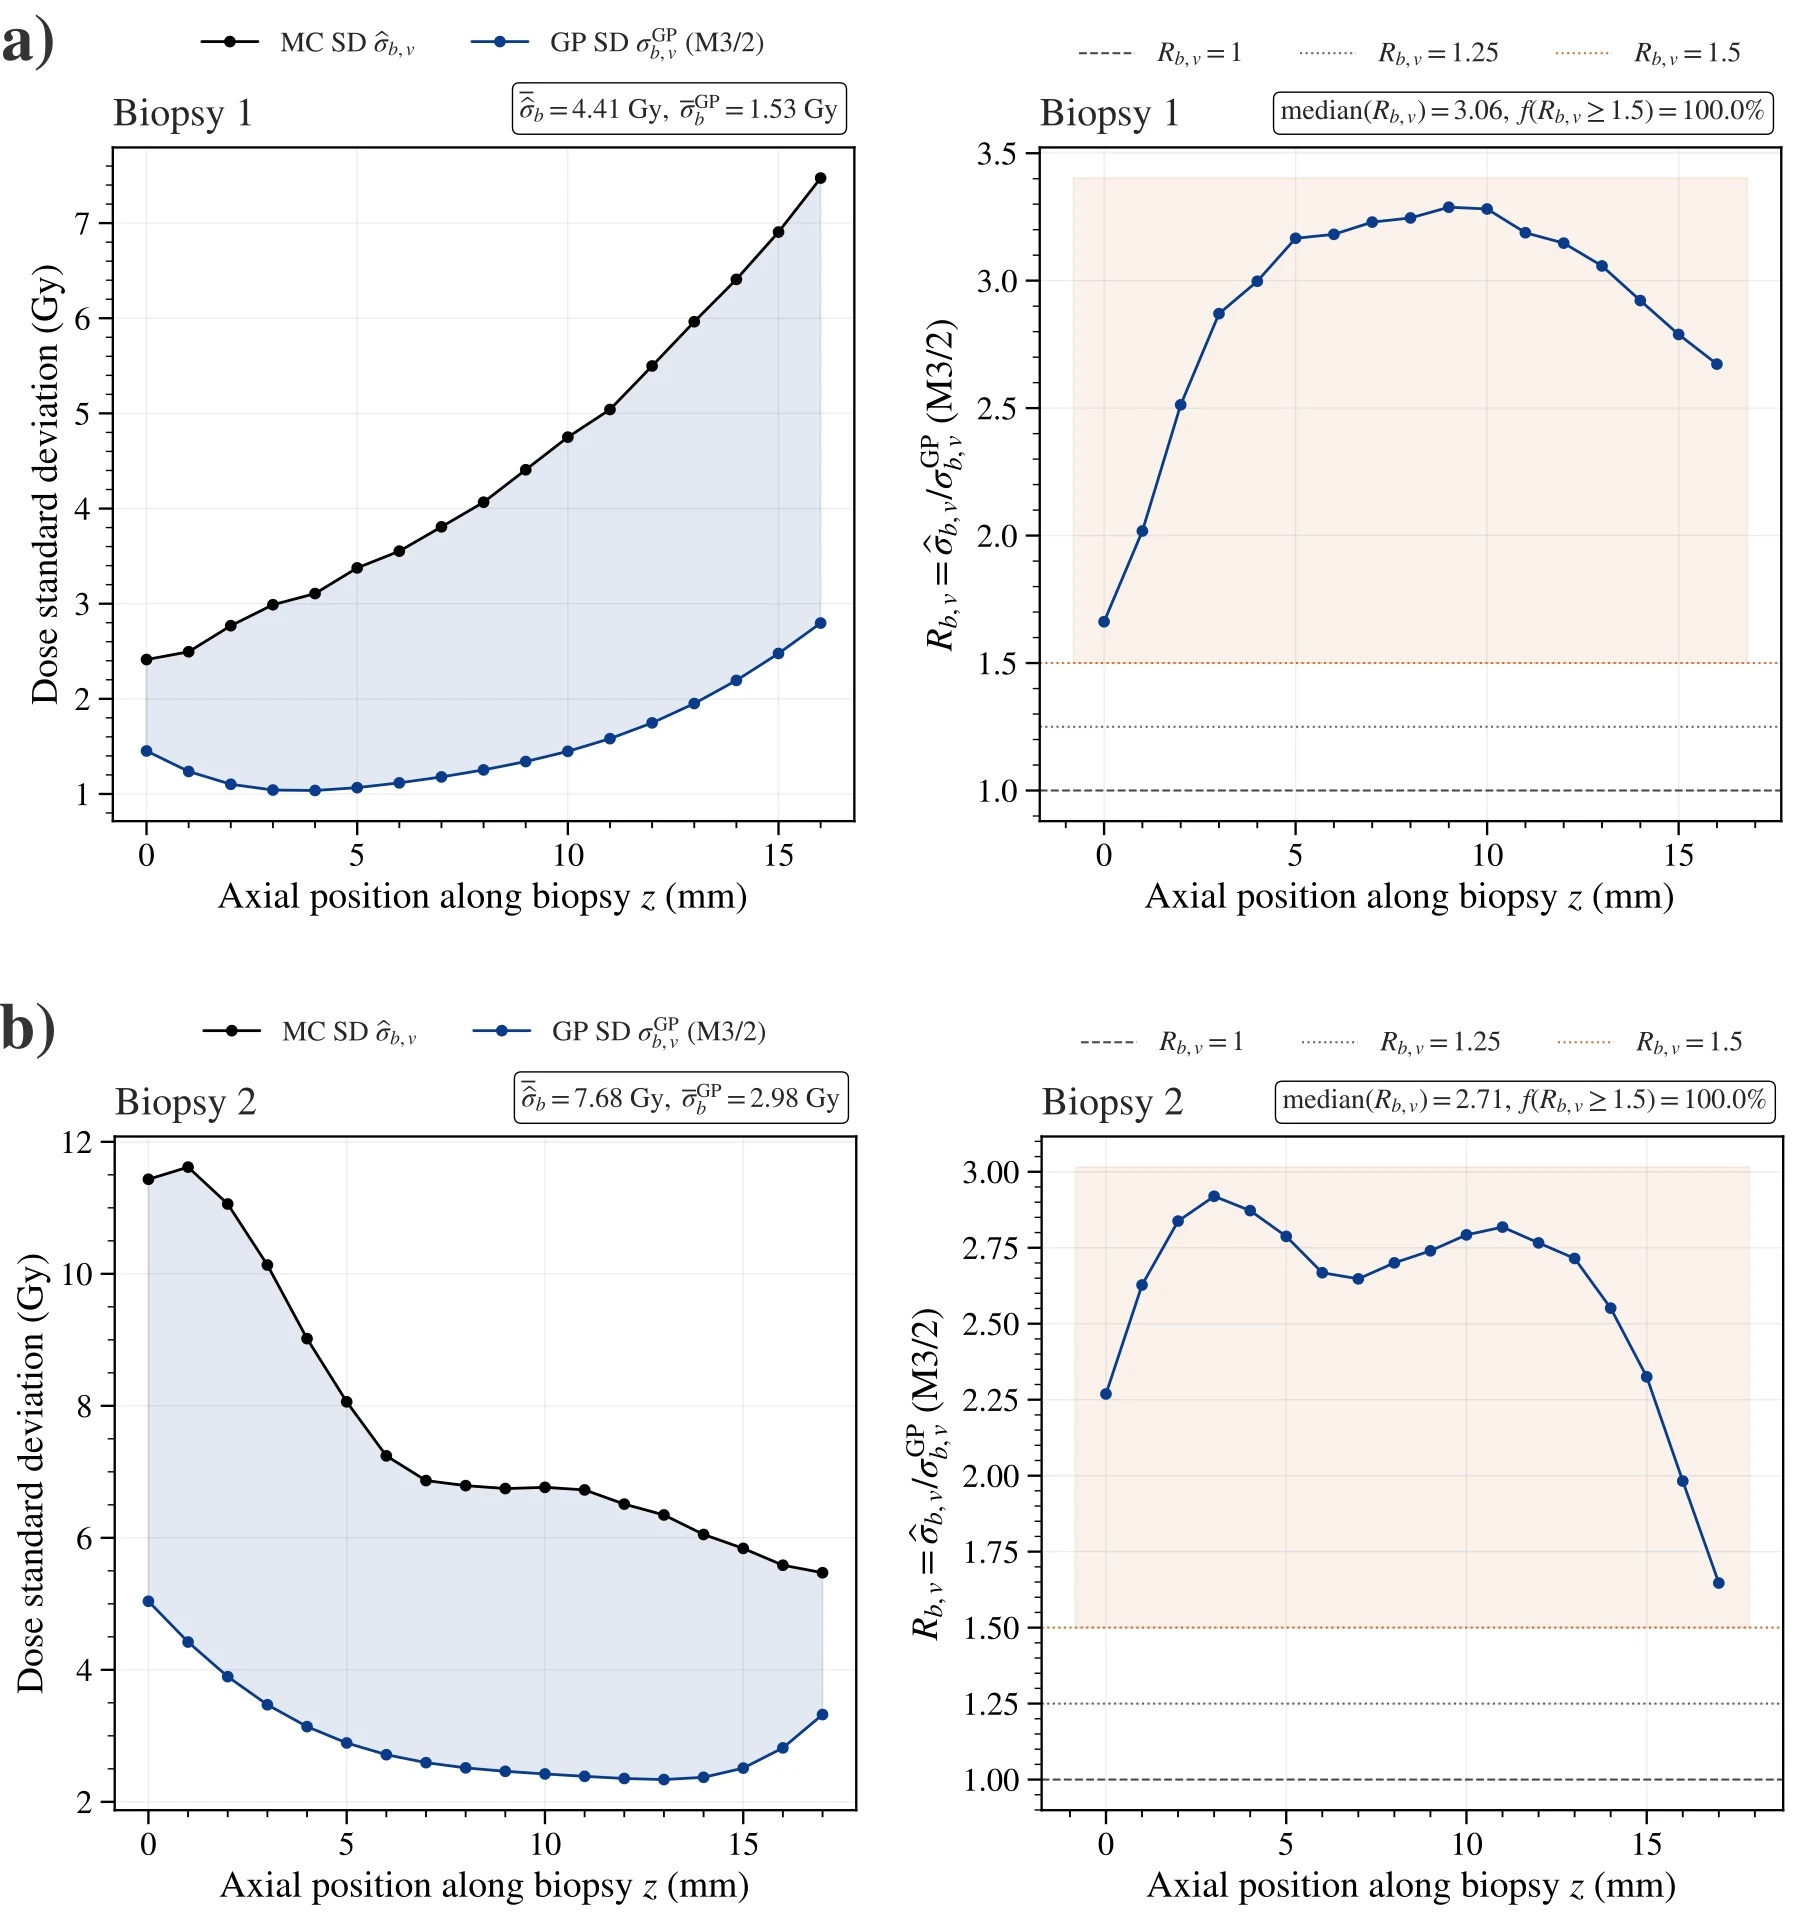
Simulated dose spread describes how the assignment changes with position. The model instead estimates an underlying, or latent, dose profile using relationships between neighbouring positions.
Check the modelling assumptions.
Compare covariance models and residual patterns alongside the earlier prediction tests.
Compare the assumptions.
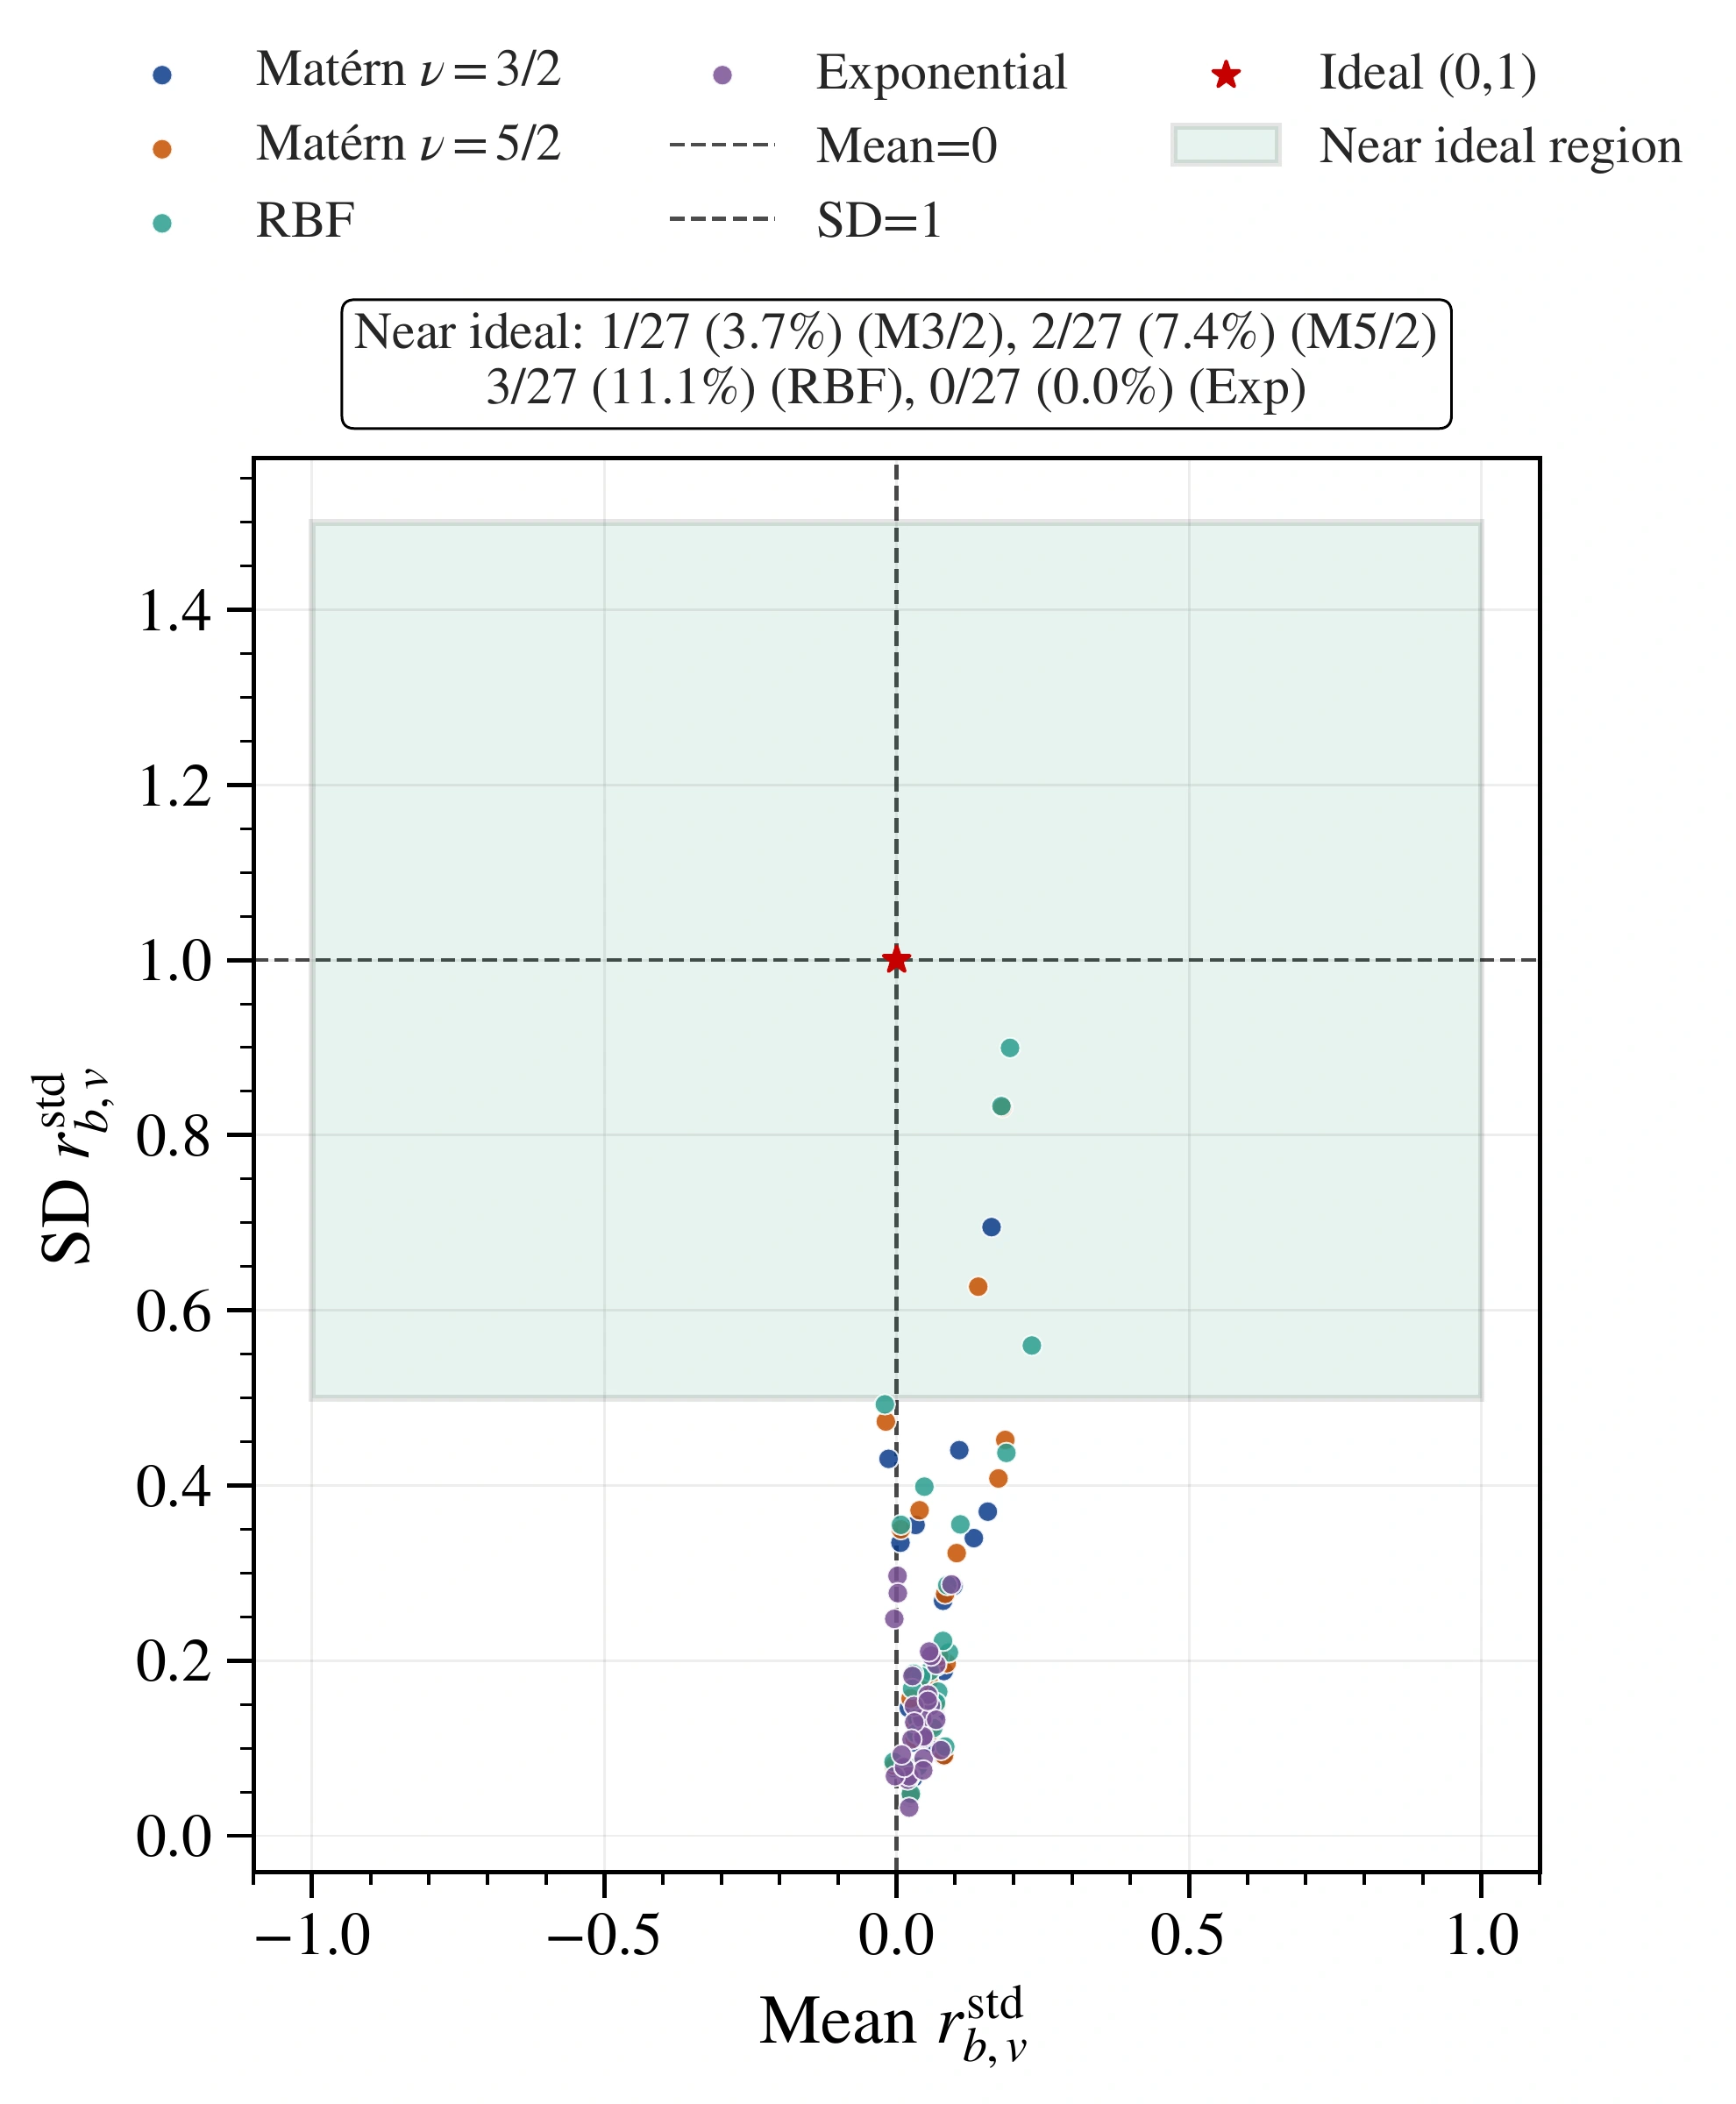
Different covariance models describe how neighbouring positions relate. Similar-looking fits do not settle the choice: held-out prediction errors matter too.
Interpretation. Model choice combines these fit checks with held-out prediction tests.
Connect dose with tissue measurements.
Use the profiles to study tissue response in its dose context and support biopsy-level QA. Further evaluation needs independent observations, additional cohorts and checks on the assumed location uncertainties.
Research status. Internal prediction tests do not establish dose accuracy in living tissue or clinical benefit.
AAPM 2026 poster
Conference version of the study. Its 58.2% mean reduction and the paper's 59.1% median describe different summaries.