Dose in an uncertain location.
Before relating tissue to radiation response, estimate the dose associated with it and the uncertainty in that assignment.
Research connections
A small shift can change the assigned dose.
In high-dose-rate (HDR) brachytherapy, dose can change sharply over a few millimetres. A small change in assumed biopsy position can therefore change the dose assigned to its tissue.
A dose distribution at each position.
Map 10,000 plausible shifts to the dose field. Compare the unshifted assignment with the simulated median and the spread across possible locations.
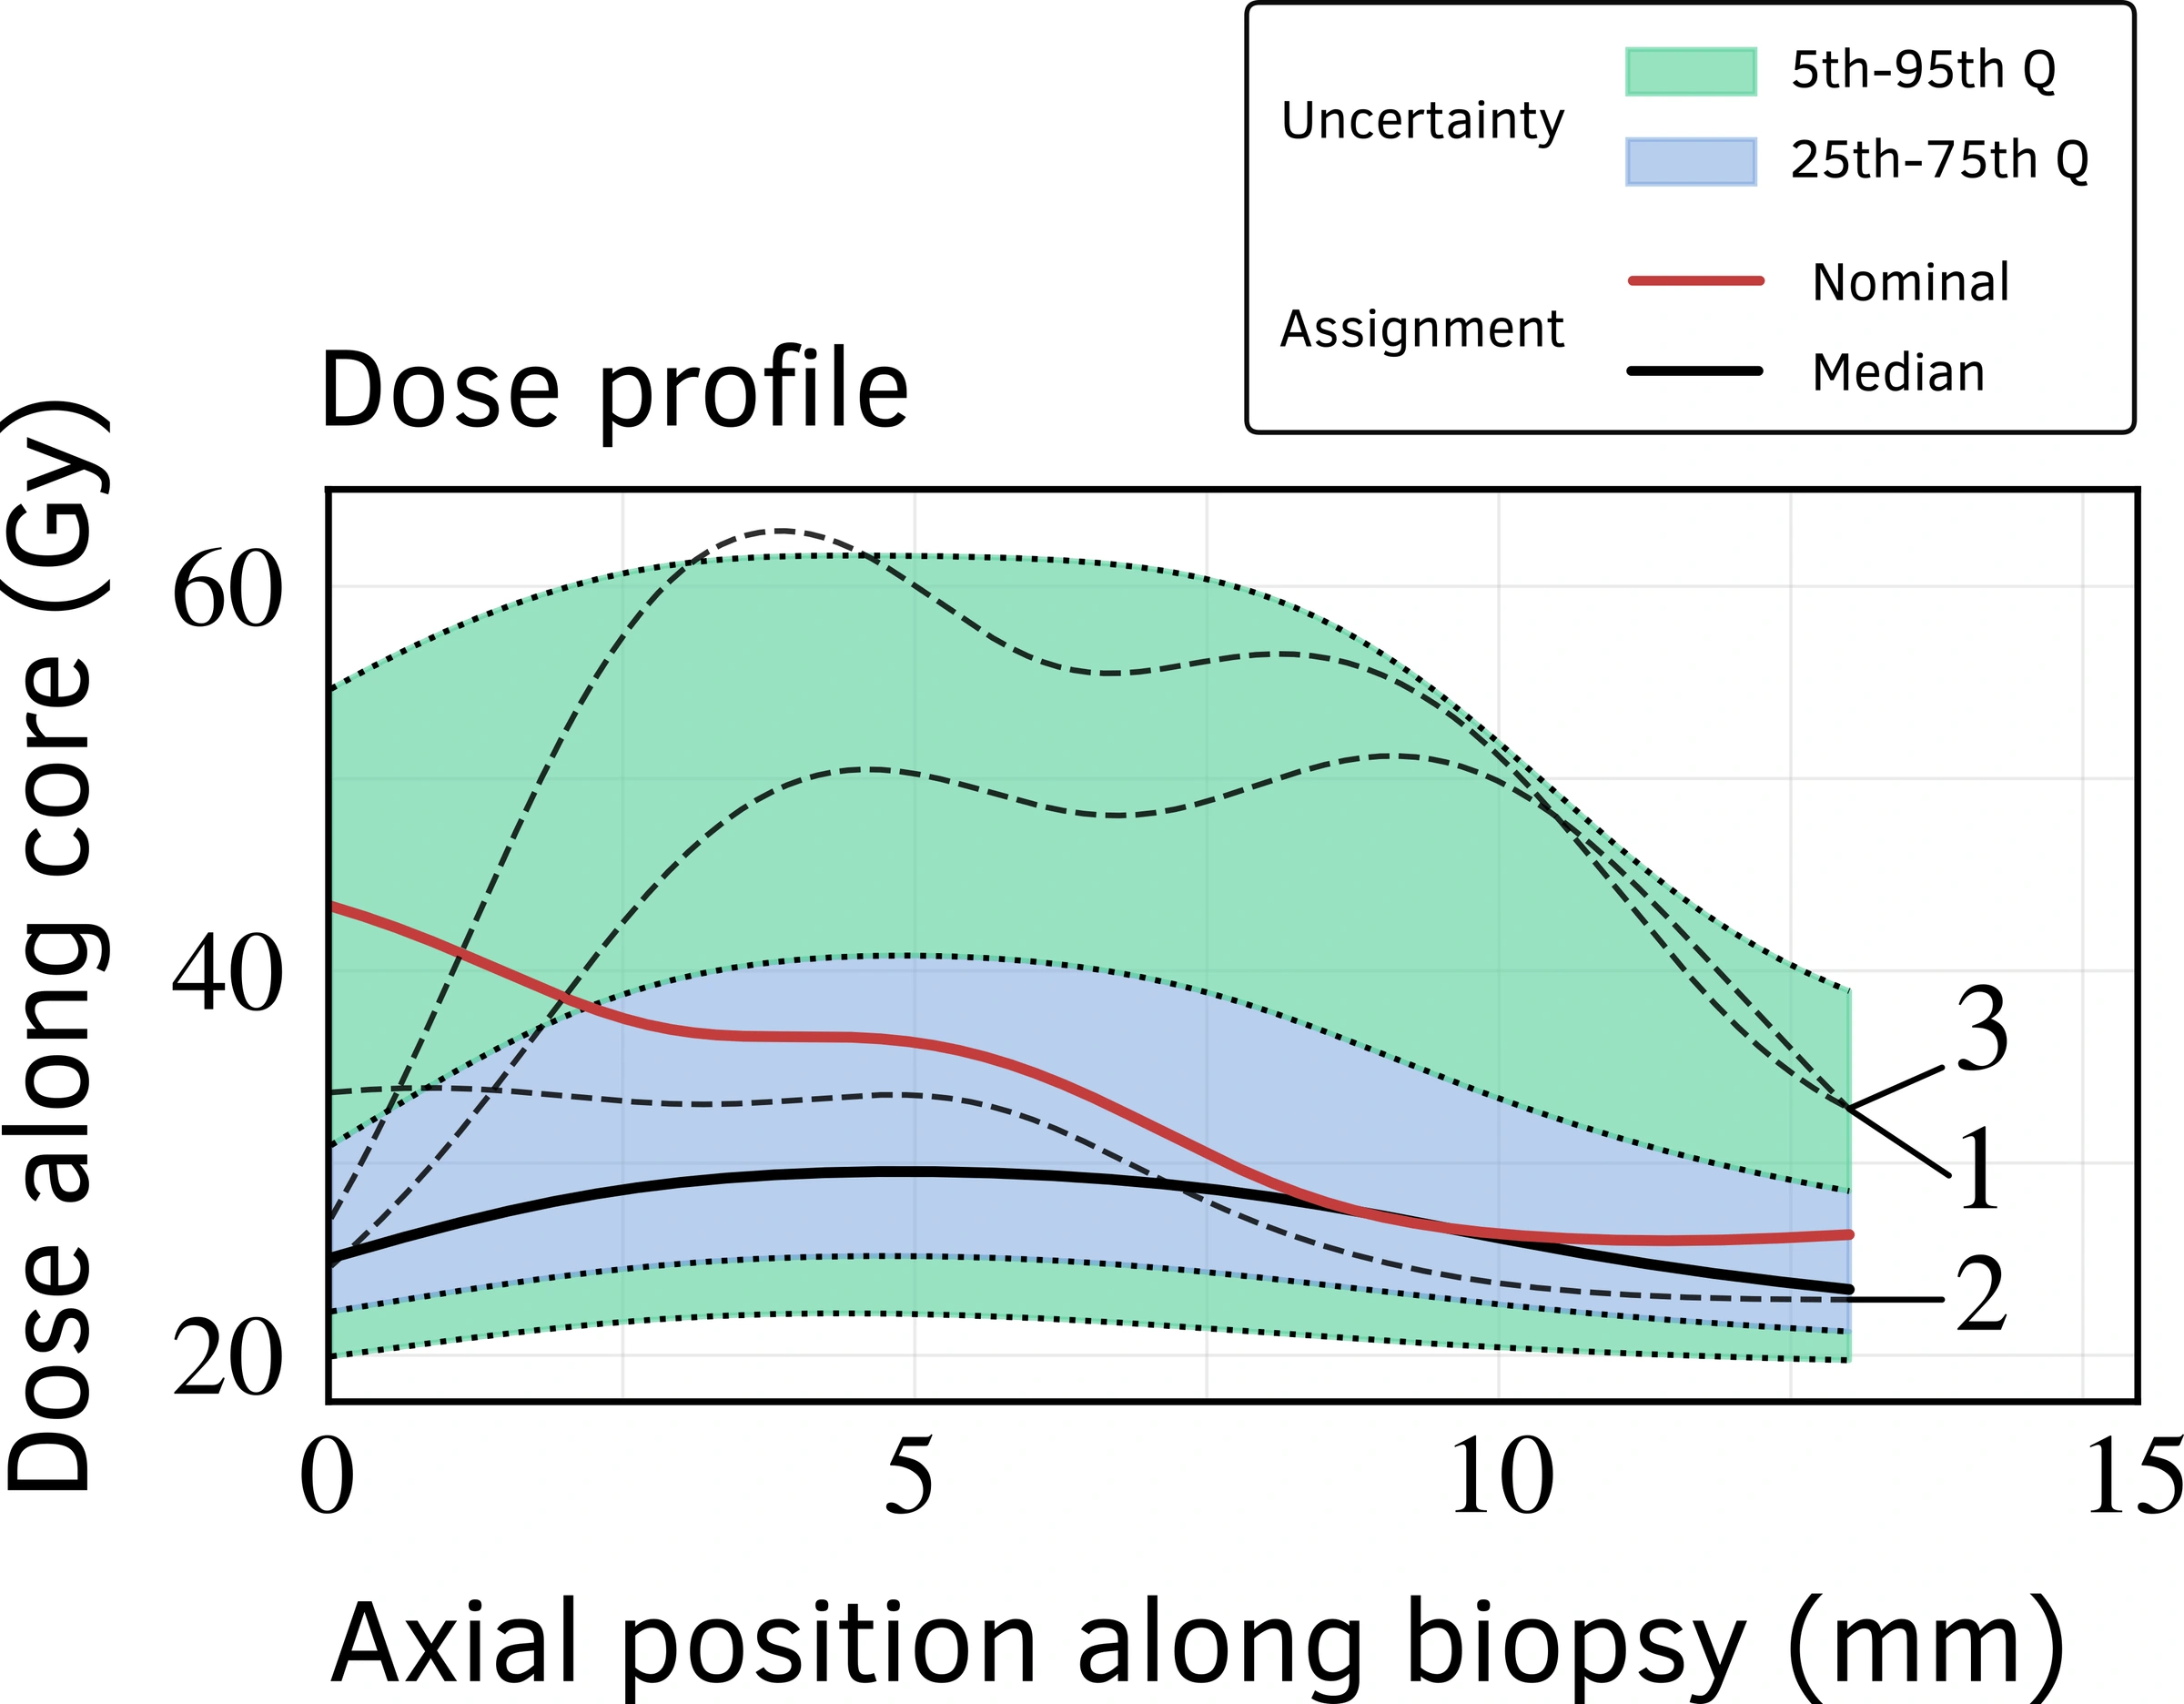
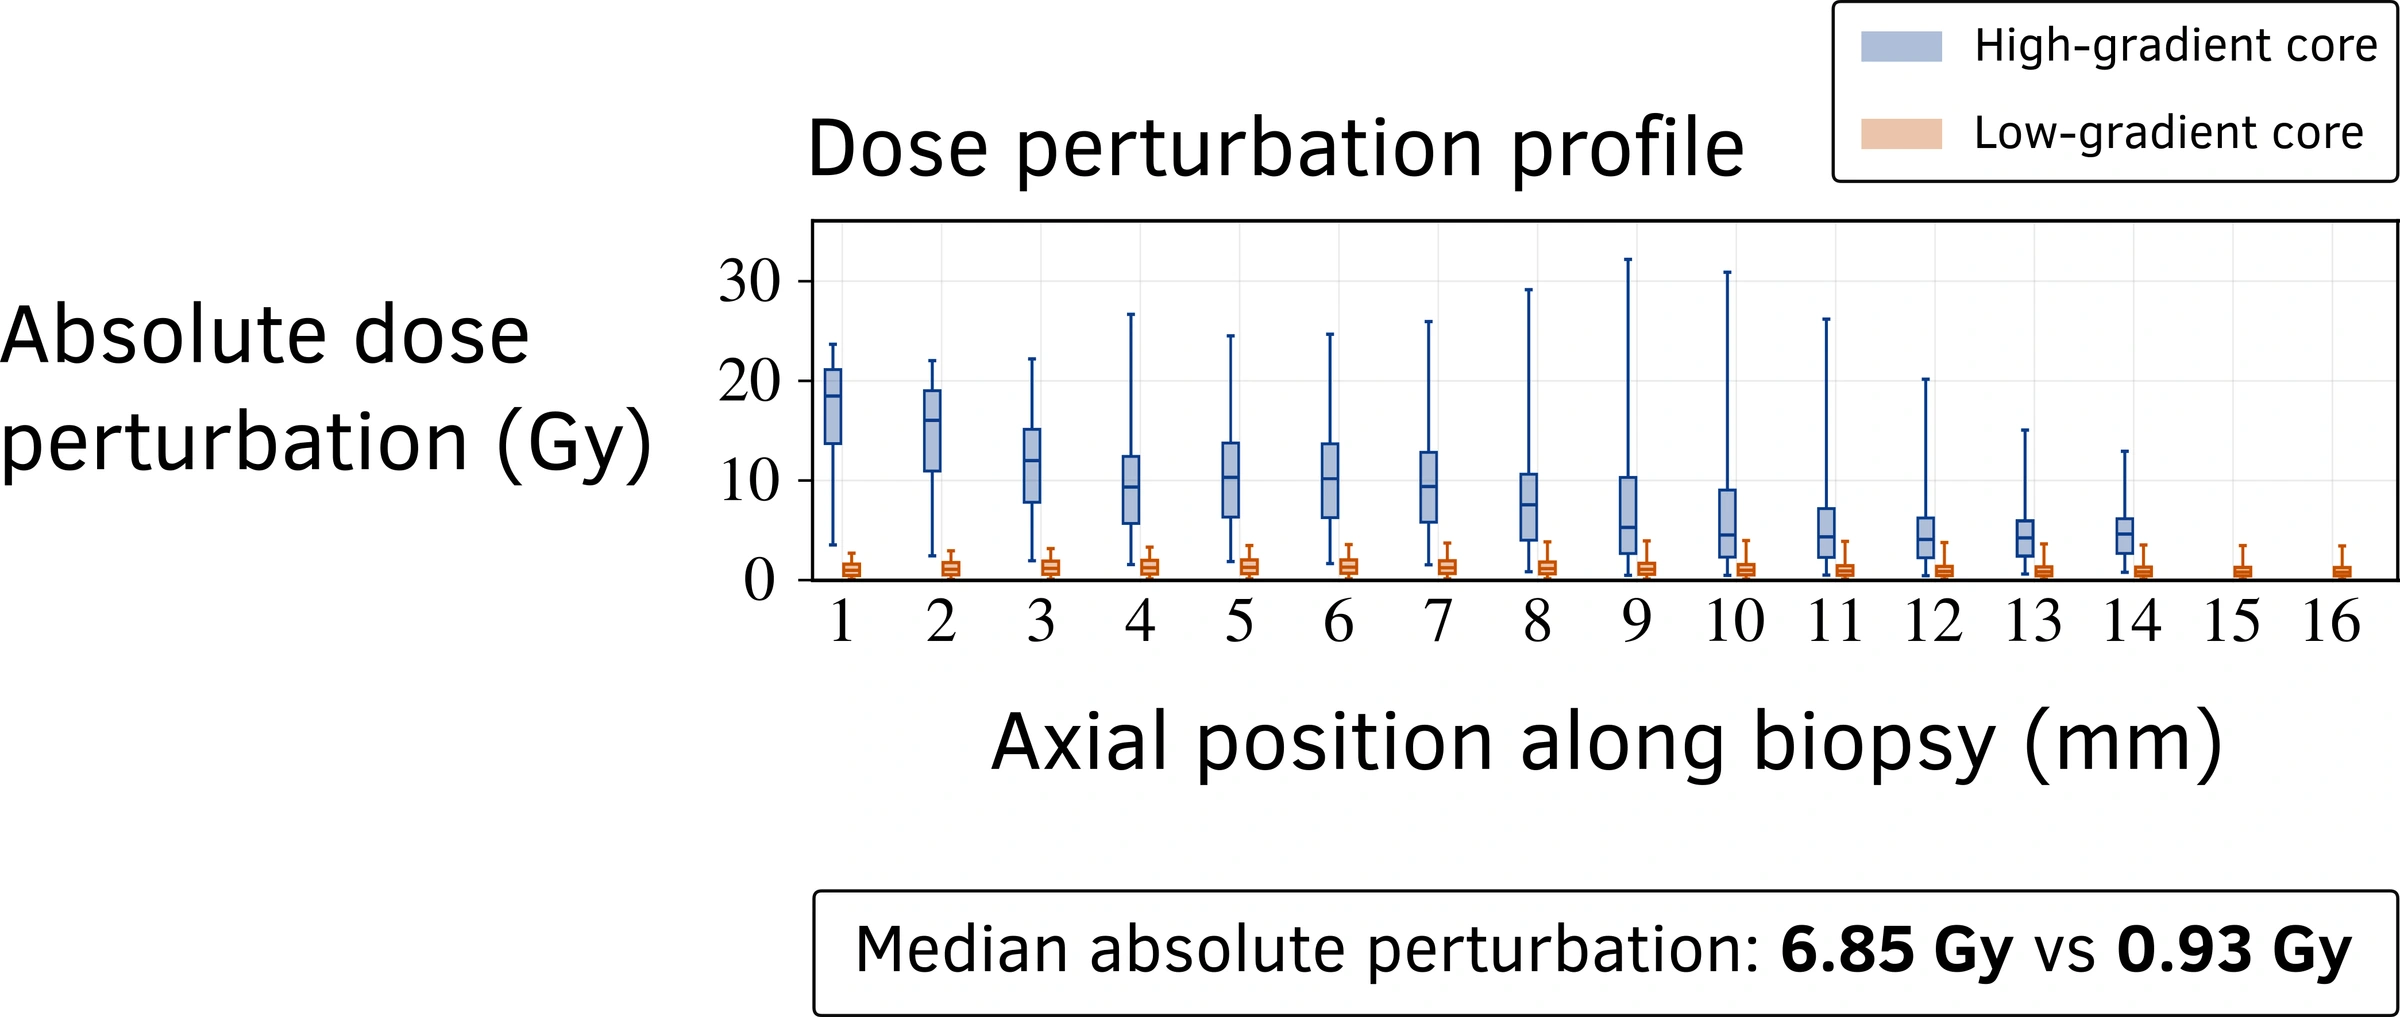
Steeper gradients make position matter more.
The core in the steeper dose gradient had a median absolute dose change of 6.85 Gy under simulated shifts, compared with 0.93 Gy in the flatter region.
Study scope. Two selected cores illustrate the effect; they do not establish a cohort-wide difference.
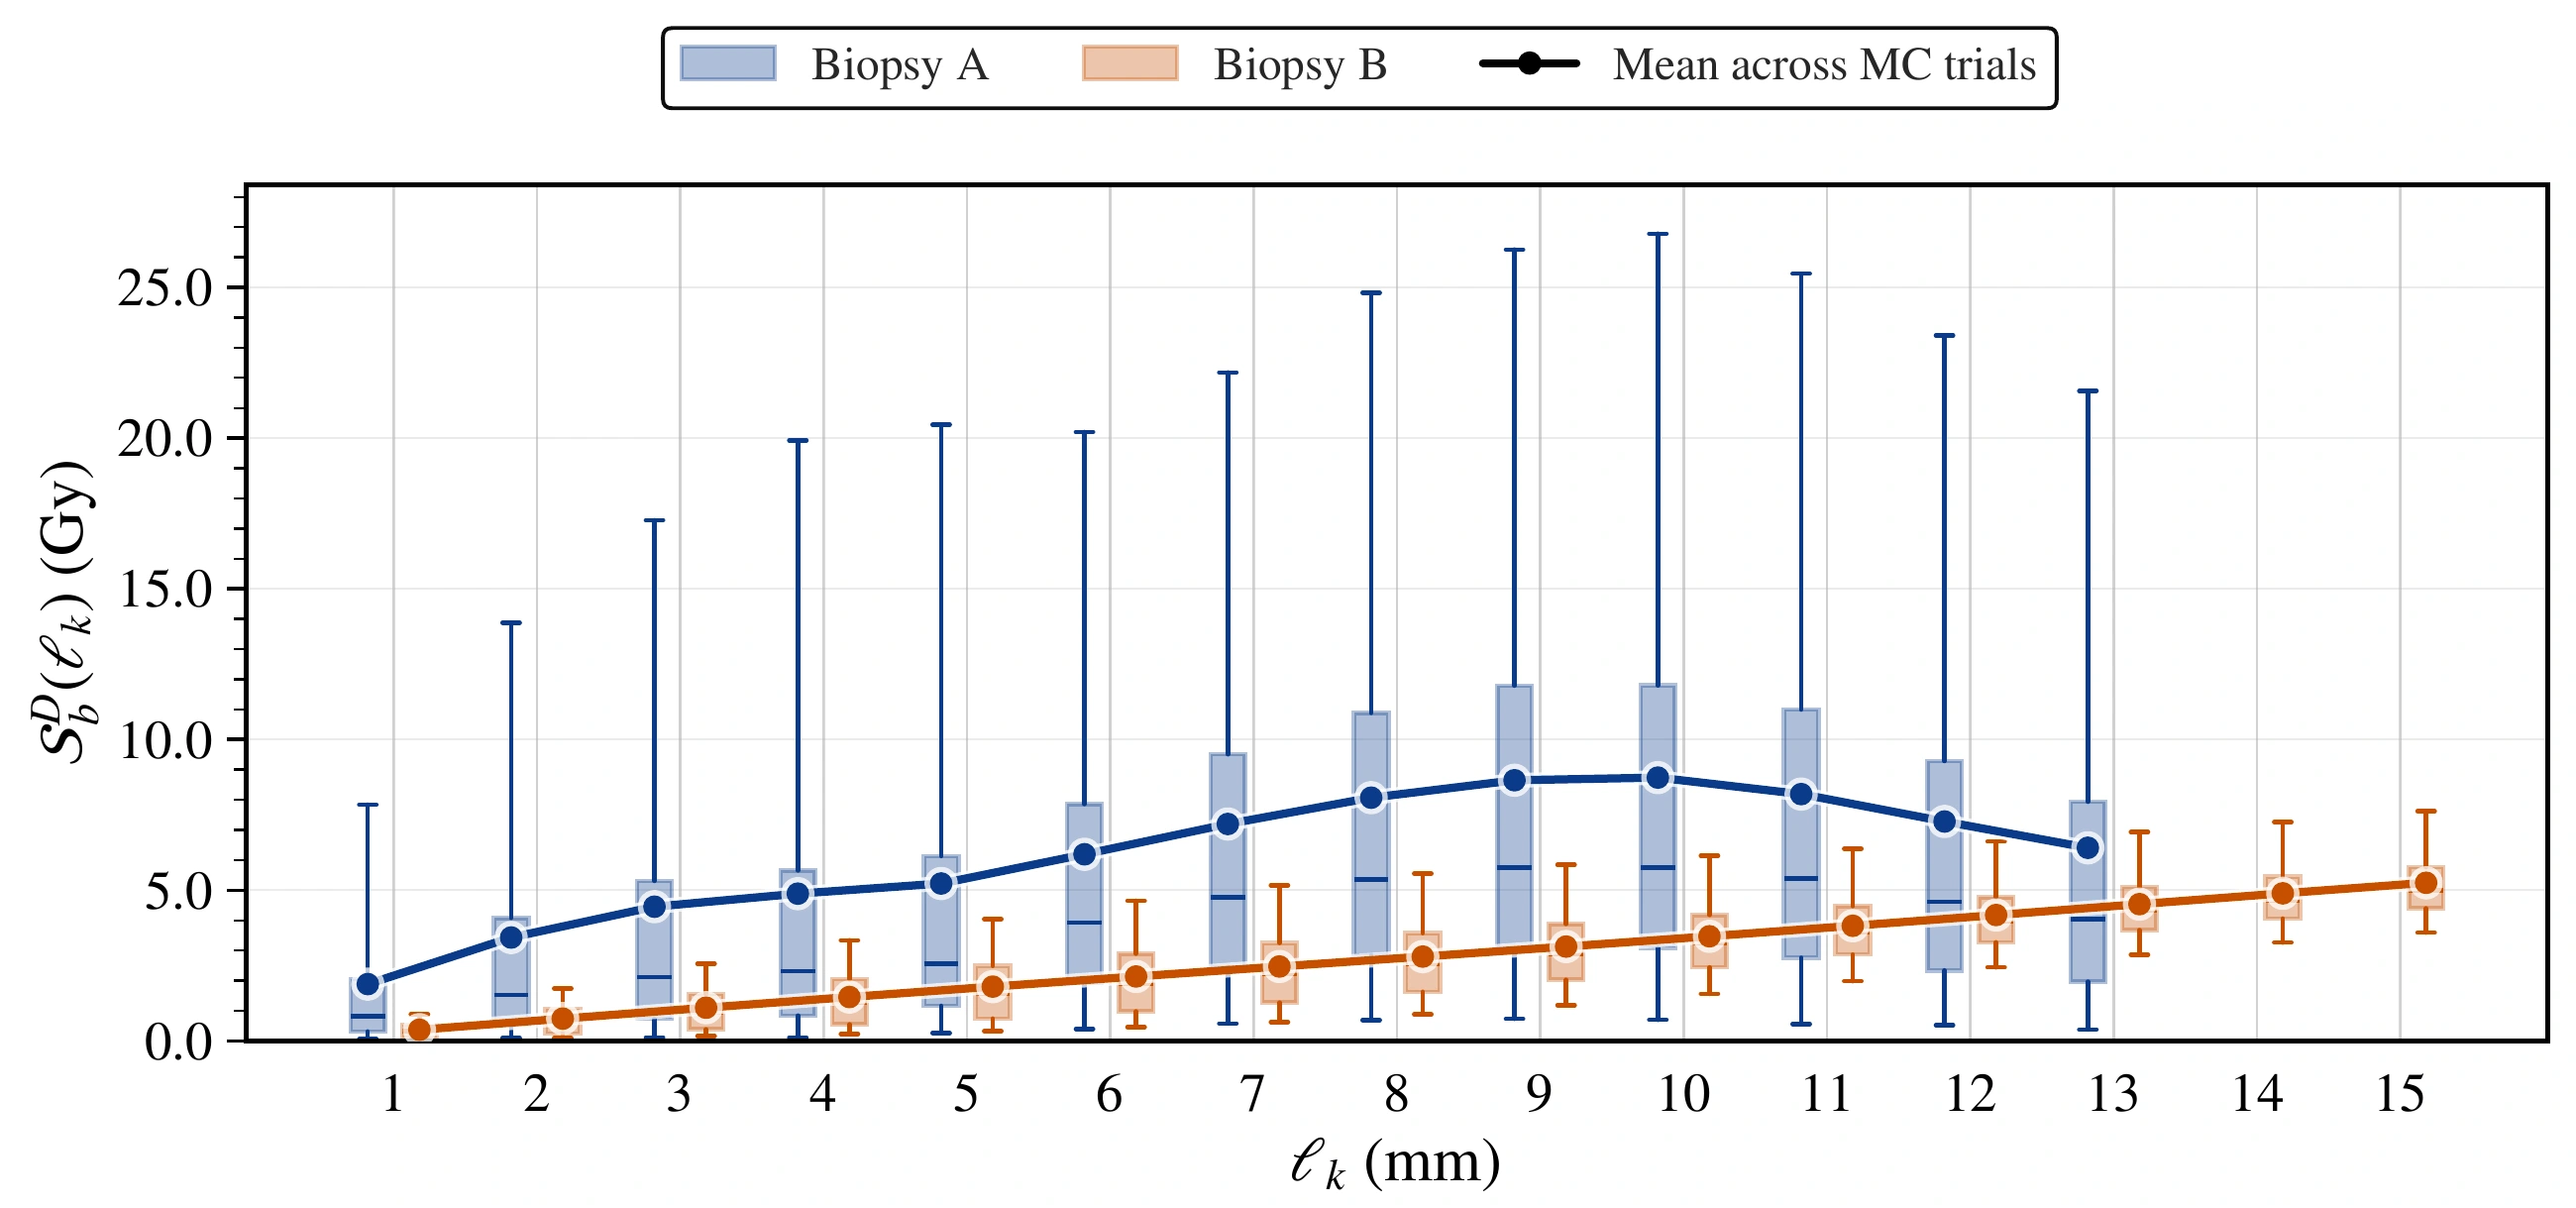
How quickly does dose change along the core?
These two examples show that dose differences depend on separation along the core. That motivates testing spatial relationships across the larger JACMP cohort and modelling them explicitly with GPR.
Interpretation. The cores have different spatial patterns. These preliminary descriptors do not define a universal segment length.
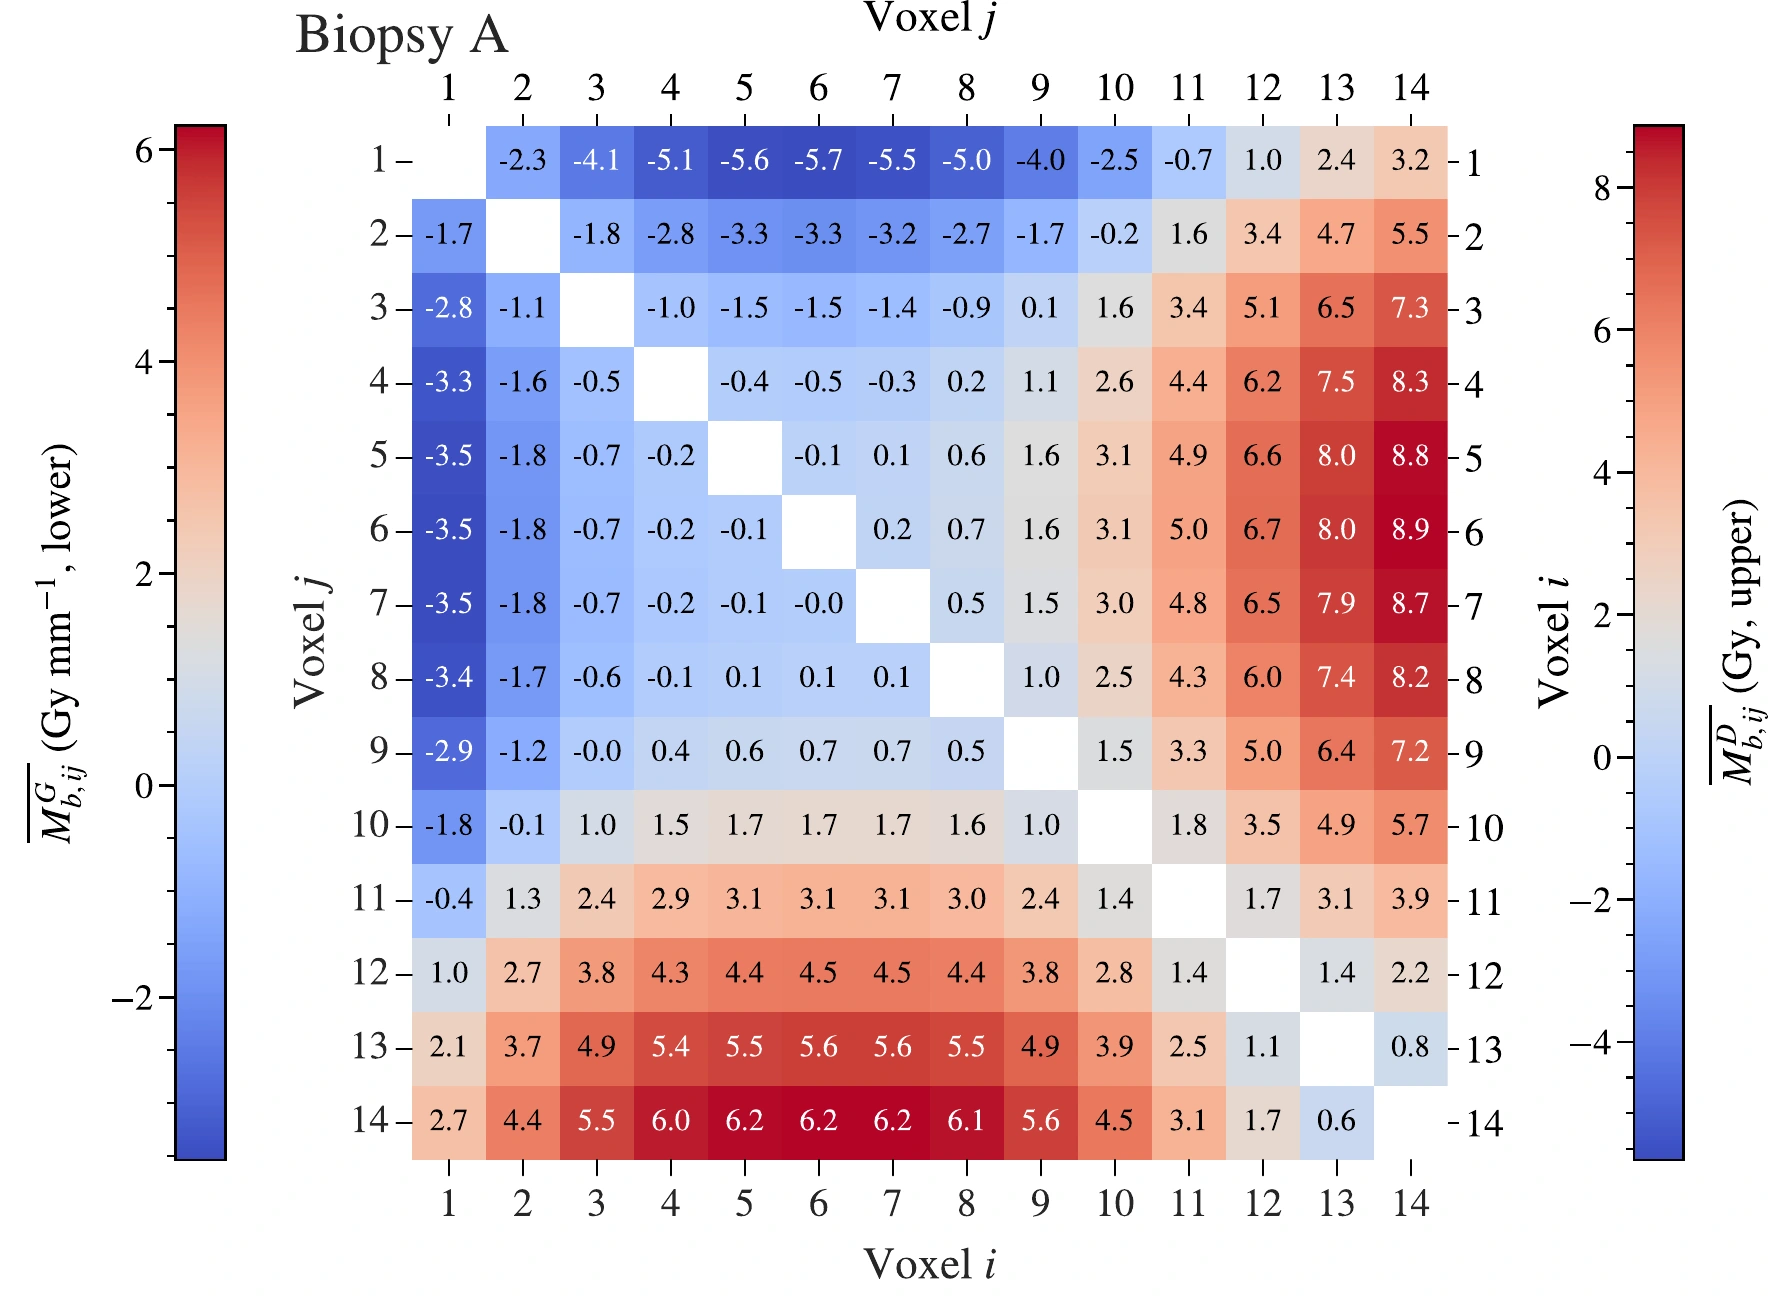
Find similar or contrasting dose regions.
Compare specific positions to identify regions with similar average dose or a deliberate dose contrast, providing a basis for selecting tissue for downstream assays.
Requirement. Matching these regions to assays depends on preserved specimen orientation and integrity.
From dose mapping to assessment and prediction.
QA tests whether dose criteria hold across plausible positions. Spatial modelling uses neighbouring positions to reconstruct and predict the dose profile. Both build on this dose-mapping foundation.
Interpretation. Mapped planned dose is not an independent measurement of dose delivered to tissue.